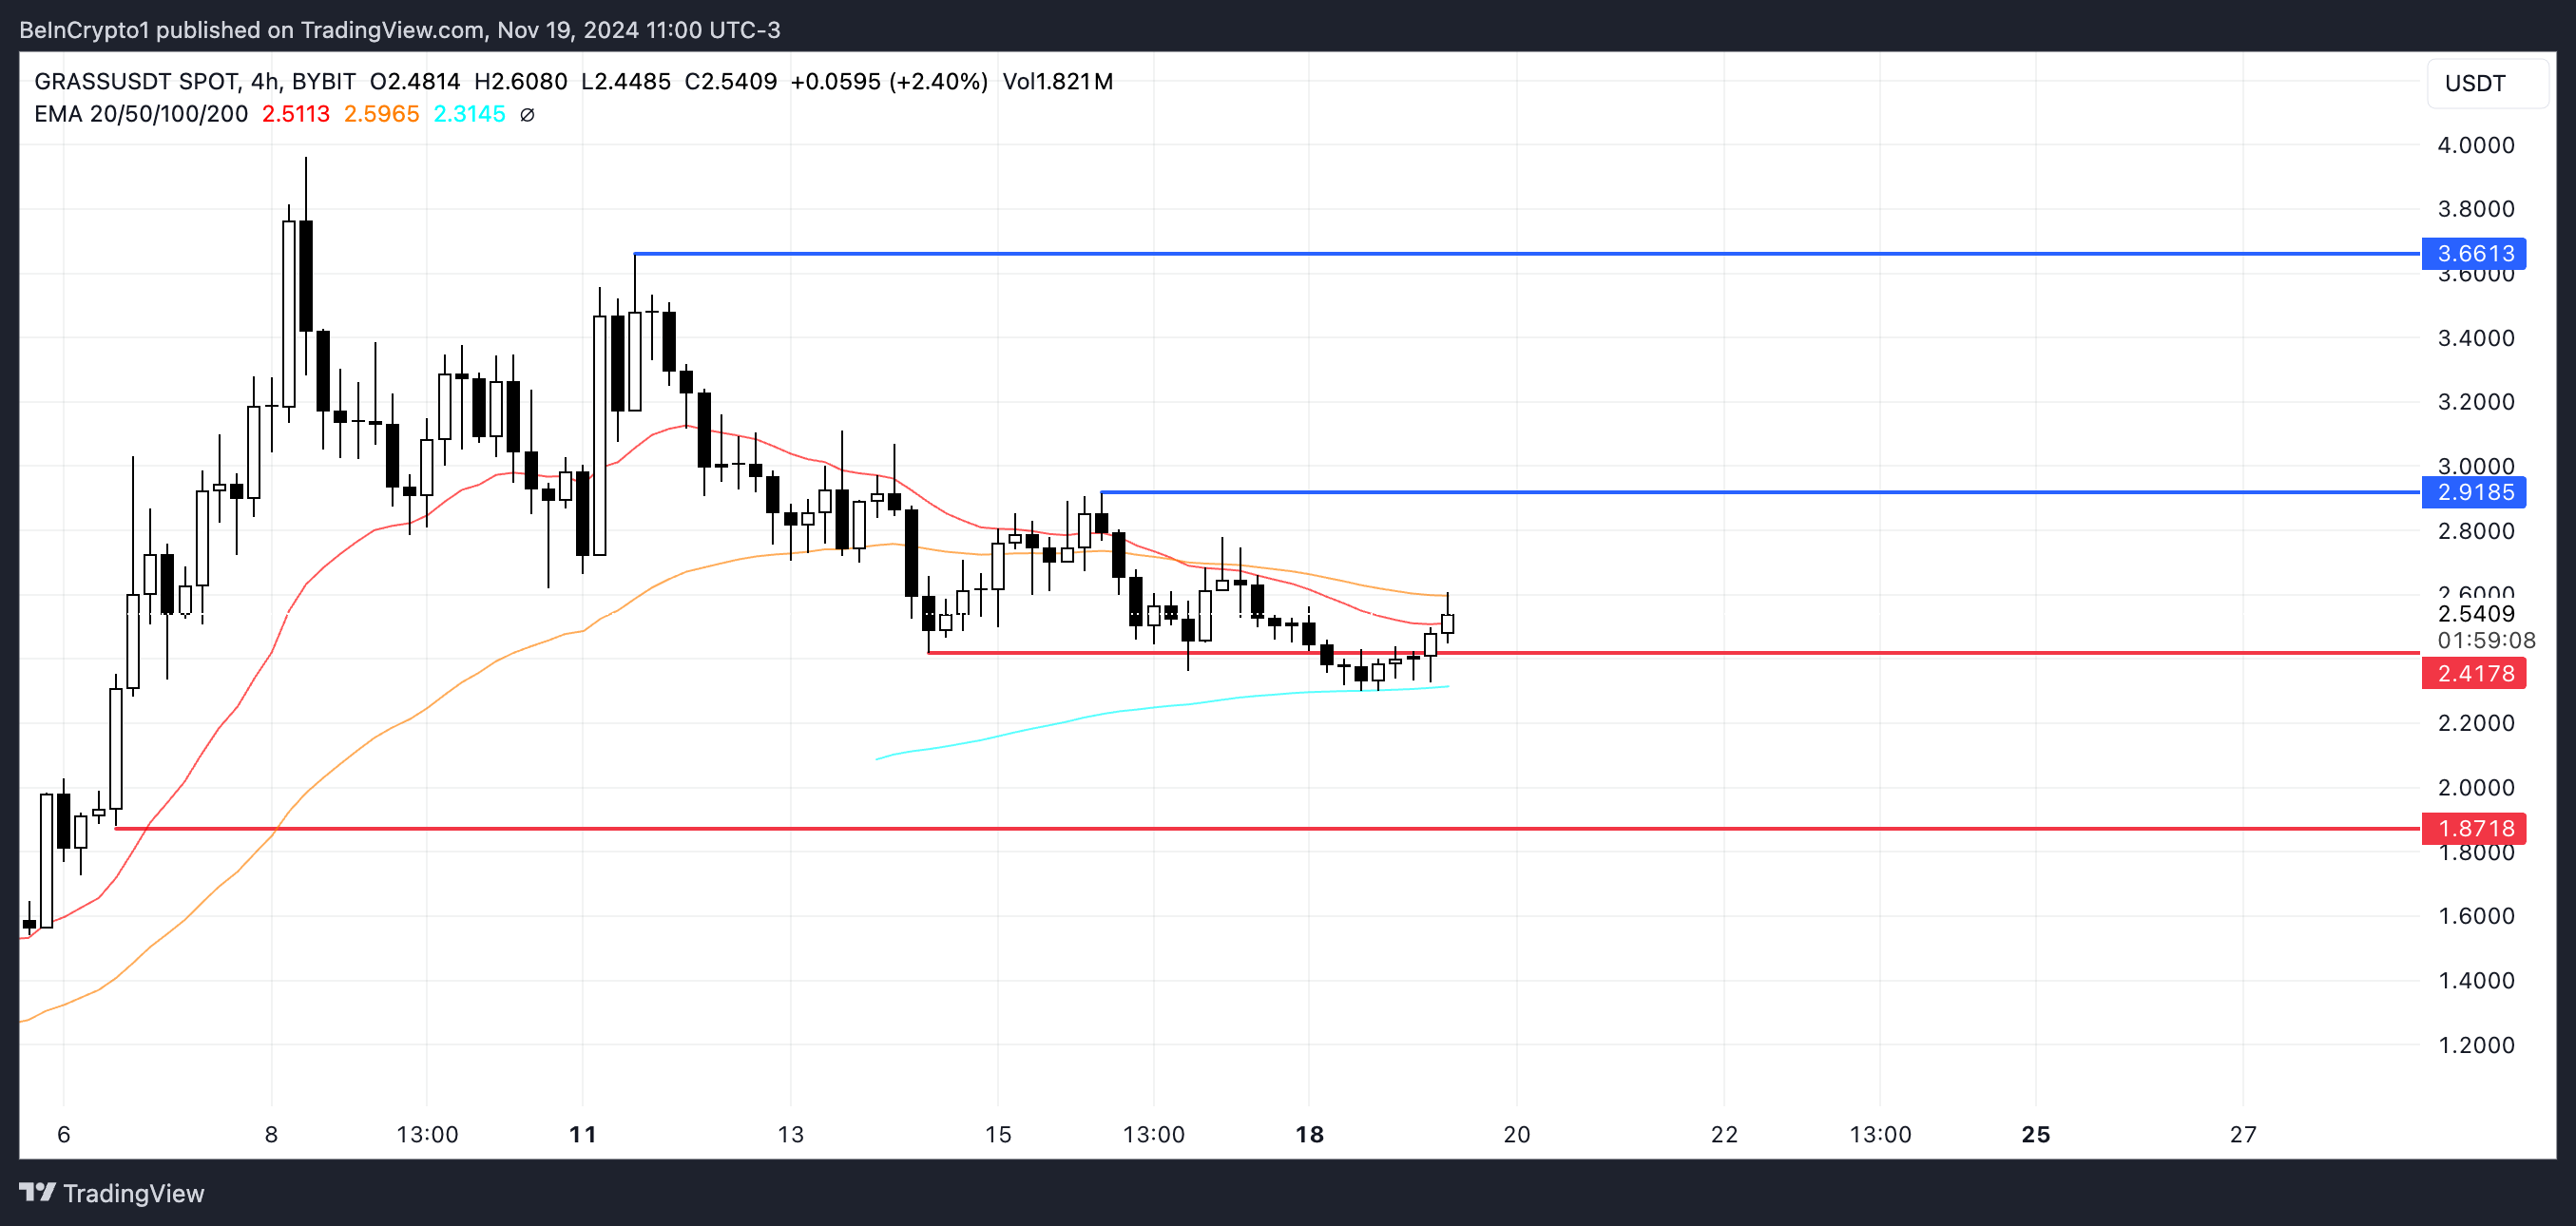
The GRASS price has shown remarkable activity since listing on major exchanges at the end of October. In the first week, the price exploded from $0.65 to $1.60. However, recent indicators show GRASS entering neutral territory, with RSI at 51 and ADX at 14.84, pointing to a moderate recovery and weak trend strength.
As traders watch for key resistance and support levels, the potential for a 44% upside or 26% downside depends heavily on the strength of the ongoing uptrend.
GRASS Is Now In The Central Region
GRASS’s Relative Strength Index (RSI) rose to 51, from a low of around 35. This change indicates a recovery in momentum, moving from an oversold condition to a more balanced state. RSI, a key indicator of momentum, measures the strength and speed of price movements, providing insight into whether an asset is overbought or oversold.
Values below 30 typically signal oversold conditions, while values above 70 suggest overbought levels. At 51, GRASS’s RSI reflects neutral momentum, implying no strong buying or selling pressure is prevailing.

Despite falling nearly 15% in the past seven days, GRASS price has increased nearly 10% in the past 24 hours. The RSI’s move to 51 is consistent with this short-term recovery, suggesting stabilization after the recent decline.
With RSI in the neutral zone, GRASS could be poised for accumulation or moderate growth, although a break above 70 could signal stronger bullish momentum for one of 2024’s biggest airdrops.
GRASS’s Current Trend Is Not Too Strong
GRASS’s Directional Movement Index (DMI) revealed an ADX value of 14.84, indicating a weak market trend. The Average Directional Derivative Index (ADX) measures the strength of a trend without indicating its direction. Typically, values above 25 signal a strong trend, while values below 20 indicate a lack of clear trend momentum.
At 14.84, ADX shows that GRASS is experiencing a period of weak trend strength, meaning price movements are less likely to move in a consistent direction.

The DMI also includes +DI (Directional Index) and -DI, which provide insight into the direction of price movement. GRASS’s +DI is at 21.26, indicating a slightly stronger buying pressure, while -DI is at 17.89, reflecting weaker selling momentum.
However, with ADX below 20, neither buying nor selling pressure is strong enough to establish a clear trend. This situation suggests a choppy market where price movements may continue without a decisive up or down trend unless ADX increases significantly.
GRASS Price Prediction: Up 44%?
GRASS’s current price is moving above the short-term EMAs, showing gradually increasing momentum in the short-term. Exponential Moving Averages (EMAs) smooth price data and clarify trends, with short-term EMAs reacting quickly to price changes.
This movement suggests that buyers are gaining control, and the asset’s immediate trend is turning positive. If this momentum continues, GRASS price could test key resistance levels, providing a clearer signal of a sustained upward move.

If the uptrend strengthens, GRASS could face the next resistance level at $2.91. A break above this level could trigger stronger upside activity, potentially pushing the price to $3.66, representing a significant 44% increase. Conversely, if the uptrend weakens, the price could turn around and test support at 2.41 USD.
Failure to hold this level could lead to a deeper correction, with the possibility of GRASS price falling to $1.87, which would mark a 26% decline. These levels highlight the importance of trend strength in determining the next significant price movement.
