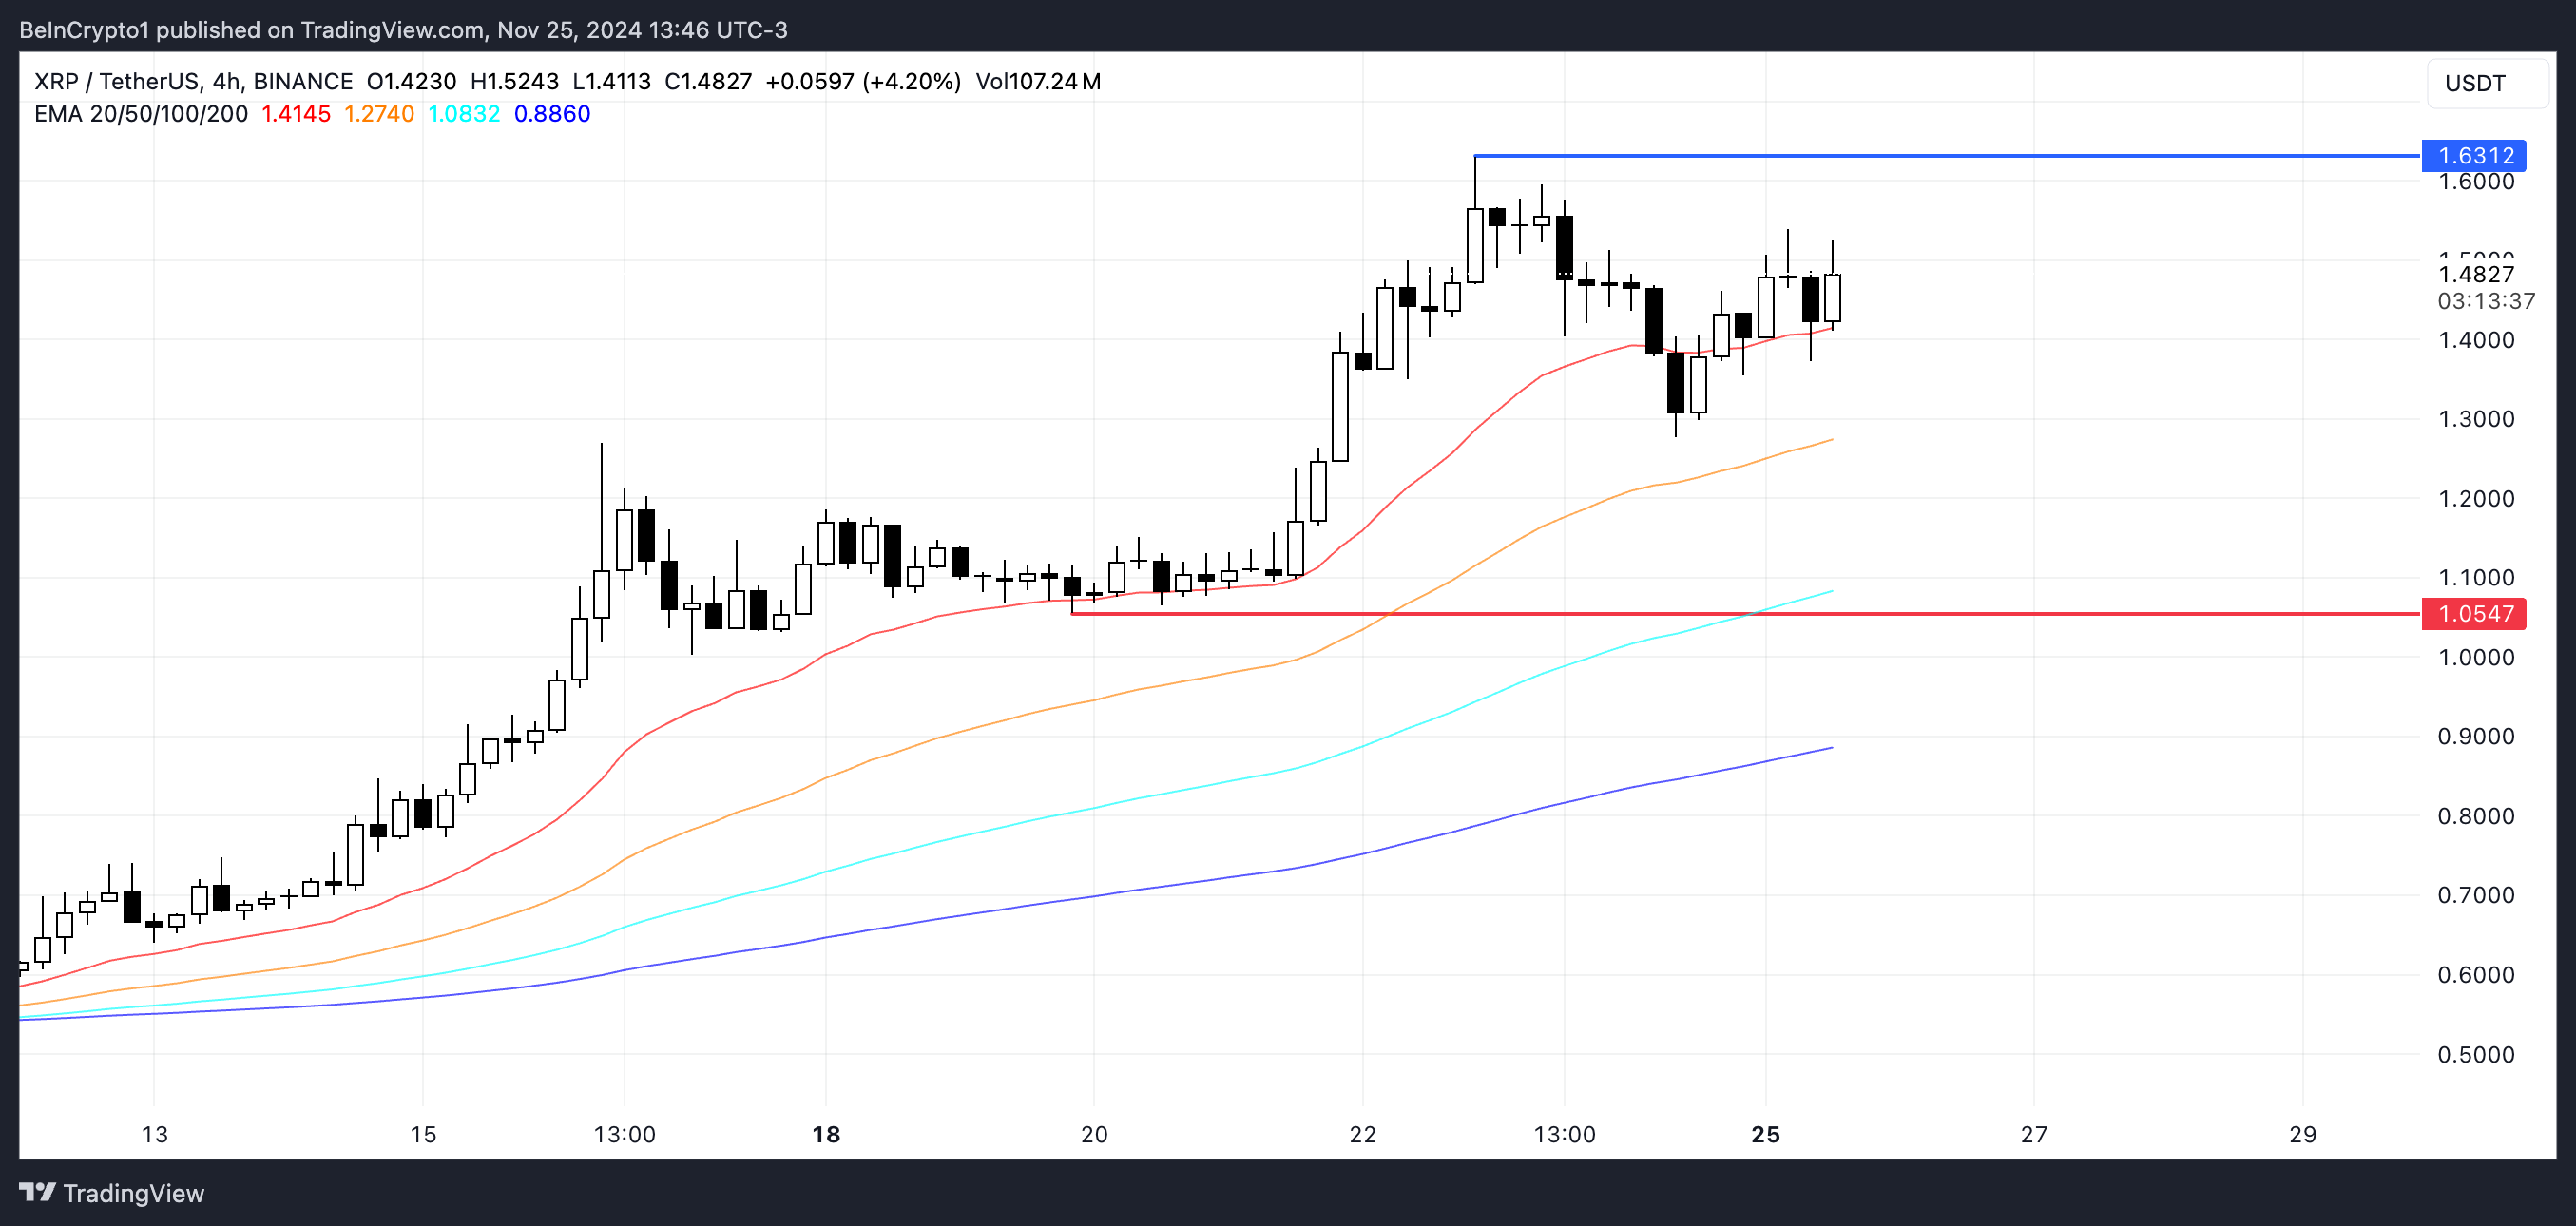
Ripple Price (XRP) has increased 182.80% in the past 30 days and 30.26% in the past week. Although the EMAs remain bullish, with the short-term lines above the long-term ones, indicators such as the RSI and CMF suggest that the uptrend may be losing momentum.
Weakening momentum could cause XRP to test support at $1.05 and face the risk of falling below $1 if selling pressure increases. However, if buyers regain control, XRP could head towards resistance at $1.63 and potentially top $1.70, its highest price since 2018.
XRP RSI Is In Neutral Zone
Currently, Ripple’s RSI is 58, down from above 70 just a few days ago. The RSI, or Relative Strength Index, measures price momentum on a scale of 0 to 100, with values above 70 signaling overbought conditions and possible pullbacks, while values above Below 30 indicates oversold conditions and a possible price recovery.
The drop from 70 to 58 reflects the cooling of bullish momentum, signaling that the recent bullish streak may be leveling off without fully entering the decline zone.

With RSI at 58, XRP remains in a healthy range, tilted towards growth but buying pressure has decreased compared to previous levels. After a 30.26% increase over the past seven days, a drop in RSI could herald a period of correction.
If RSI continues to decline, it could imply increased selling pressure, leading to a price correction. However, if RSI stabilizes or increases, XRP price could regain momentum and attempt to capture more growth momentum.
CMF Ripple Index Drops Strongly
XRP’s CMF is currently 0.02, down from 0.11 just two days ago, hinting at a significant reduction in buying pressure. CMF, or Chaikin Cash Flow, measures the flow of capital into or out of an asset over a period, with values above zero indicating net capital inflows (buying pressure) and values below zero reflecting net capital outflows ( selling pressure).
As of November 22, Ripple’s CMF remains positive, showing that buyers remain dominant despite the recent decline.

With CMF at 0.02, Ripple still reflects a slight net inflow, suggesting that the bullish sentiment is not completely gone but is weakening. If CMF turns negative, it would indicate a shift to net capital outflows, potentially signaling increased selling pressure and a possible price correction.
For now, a positive CMF supports an optimistic but cautious outlook, but further declines could signal the start of a downtrend for XRP price dynamics.
Ripple Price Forecast: Is $1.70 On Its Way?
XRP’s EMAs hold the bullish setup, with short-term ones above long-term ones, indicating that the overall trend remains upward. However, other indicators such as CMF and RSI suggest that the uptrend may be losing momentum.

If the uptrend weakens further and a downtrend emerges, XRP price could test critical support around $1.05, potentially falling below $1 if selling pressure intensifies.
Conversely, if the uptrend regains strength, XRP price could break above the resistance at $1.63 and head towards $1.70, which would mark its highest price since 2018.
