The price of Dogwifhat (WIF) hit its highest level since March 2024 earlier this month, marking a staggering 1,386% gain this year. However, WIF encountered a correction, falling about 11% in the past 24 hours as strong bearish signals are increasing.
Momentum indicators such as the Ichimoku cloud and ADX are pointing to a strong bearish trend, with sellers dominating the market. Whether WIF can hold key support levels or recover enough strength to test resistance will determine its near-term trajectory.
Dogwifhat: Ichimoku Cloud indicates a sharp decrease in configuration
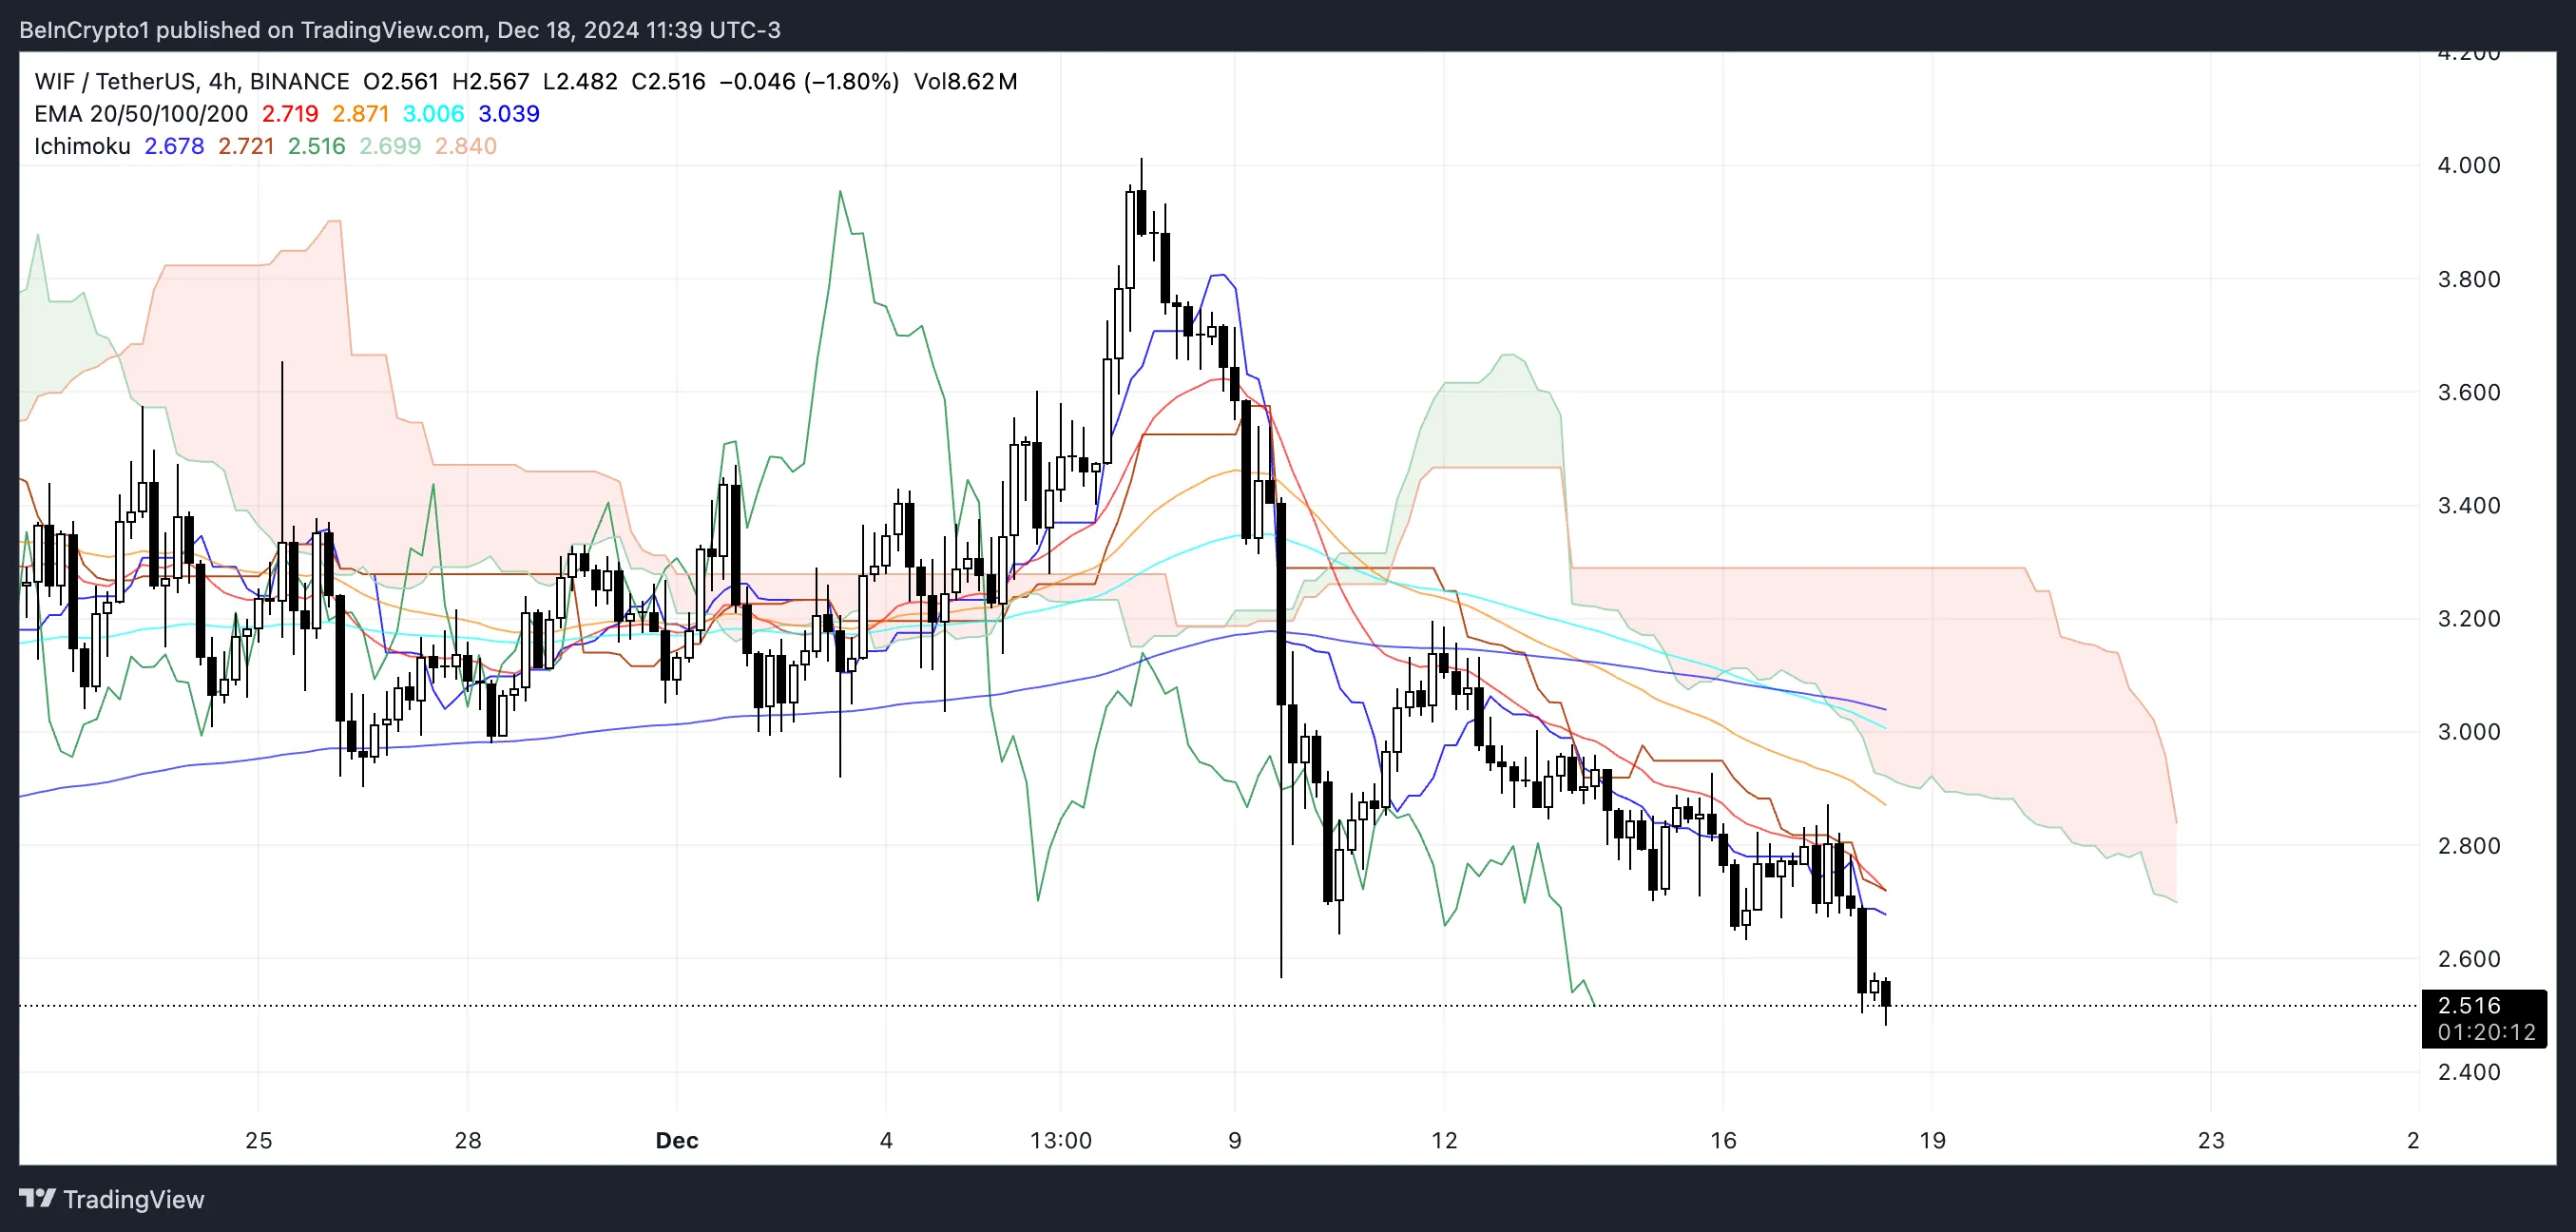
The Ichimoku chart of WIF shows a clear downtrend as the price has broken below both the Kumo cloud and all major components of the Ichimoku. The conversion line (blue) has crossed below the baseline (red), creating a bearish signal. The lag gap, shown in green, has also moved down significantly, pointing to strong downward momentum.
Since the beginning of December, price action has consistently produced lower highs and lower lows, with the latest move showing a drastic decline.

In early December, the cloud structure transformed from a bullish supportive blue cloud to a bearish red cloud, with Leading Span A (red) crossing below Leading Span B (orange). The change in cloud color and expansion suggests increased downward pressure.
The fact that the price is trading well below the cloud, with all Ichimoku components lining up above the current price – the conversion line, the base line and both cloud gaps – suggests a strong downtrend is likely. ability to continue unless the price can recover at least to the conversion line level.
WIF: ADX indicates that the current downtrend is strengthening
WIF’s ADX index is currently at 38, up from 36 yesterday, signaling a strong and rising trend. However, with WIF in a downtrend, rising ADX shows that the bearish momentum is strengthening. This suggests that the downward movement is likely to continue, as sellers remain dominant in the market.

ADX (Average Directional Index) measures the strength of a price trend without indicating its direction. An ADX above 25 indicates a strong trend, while a reading below 20 suggests a weak or no-trend market.
With dogwifhat’s ADX at 38 and its current downtrend, the price could face further declines in the short term unless buying emerges to counter the downside momentum. If sellers continue, WIF prices may continue to decline before finding stability.
Dogwifhat Price Prediction: Can WIF Return to $4 Until 2025?
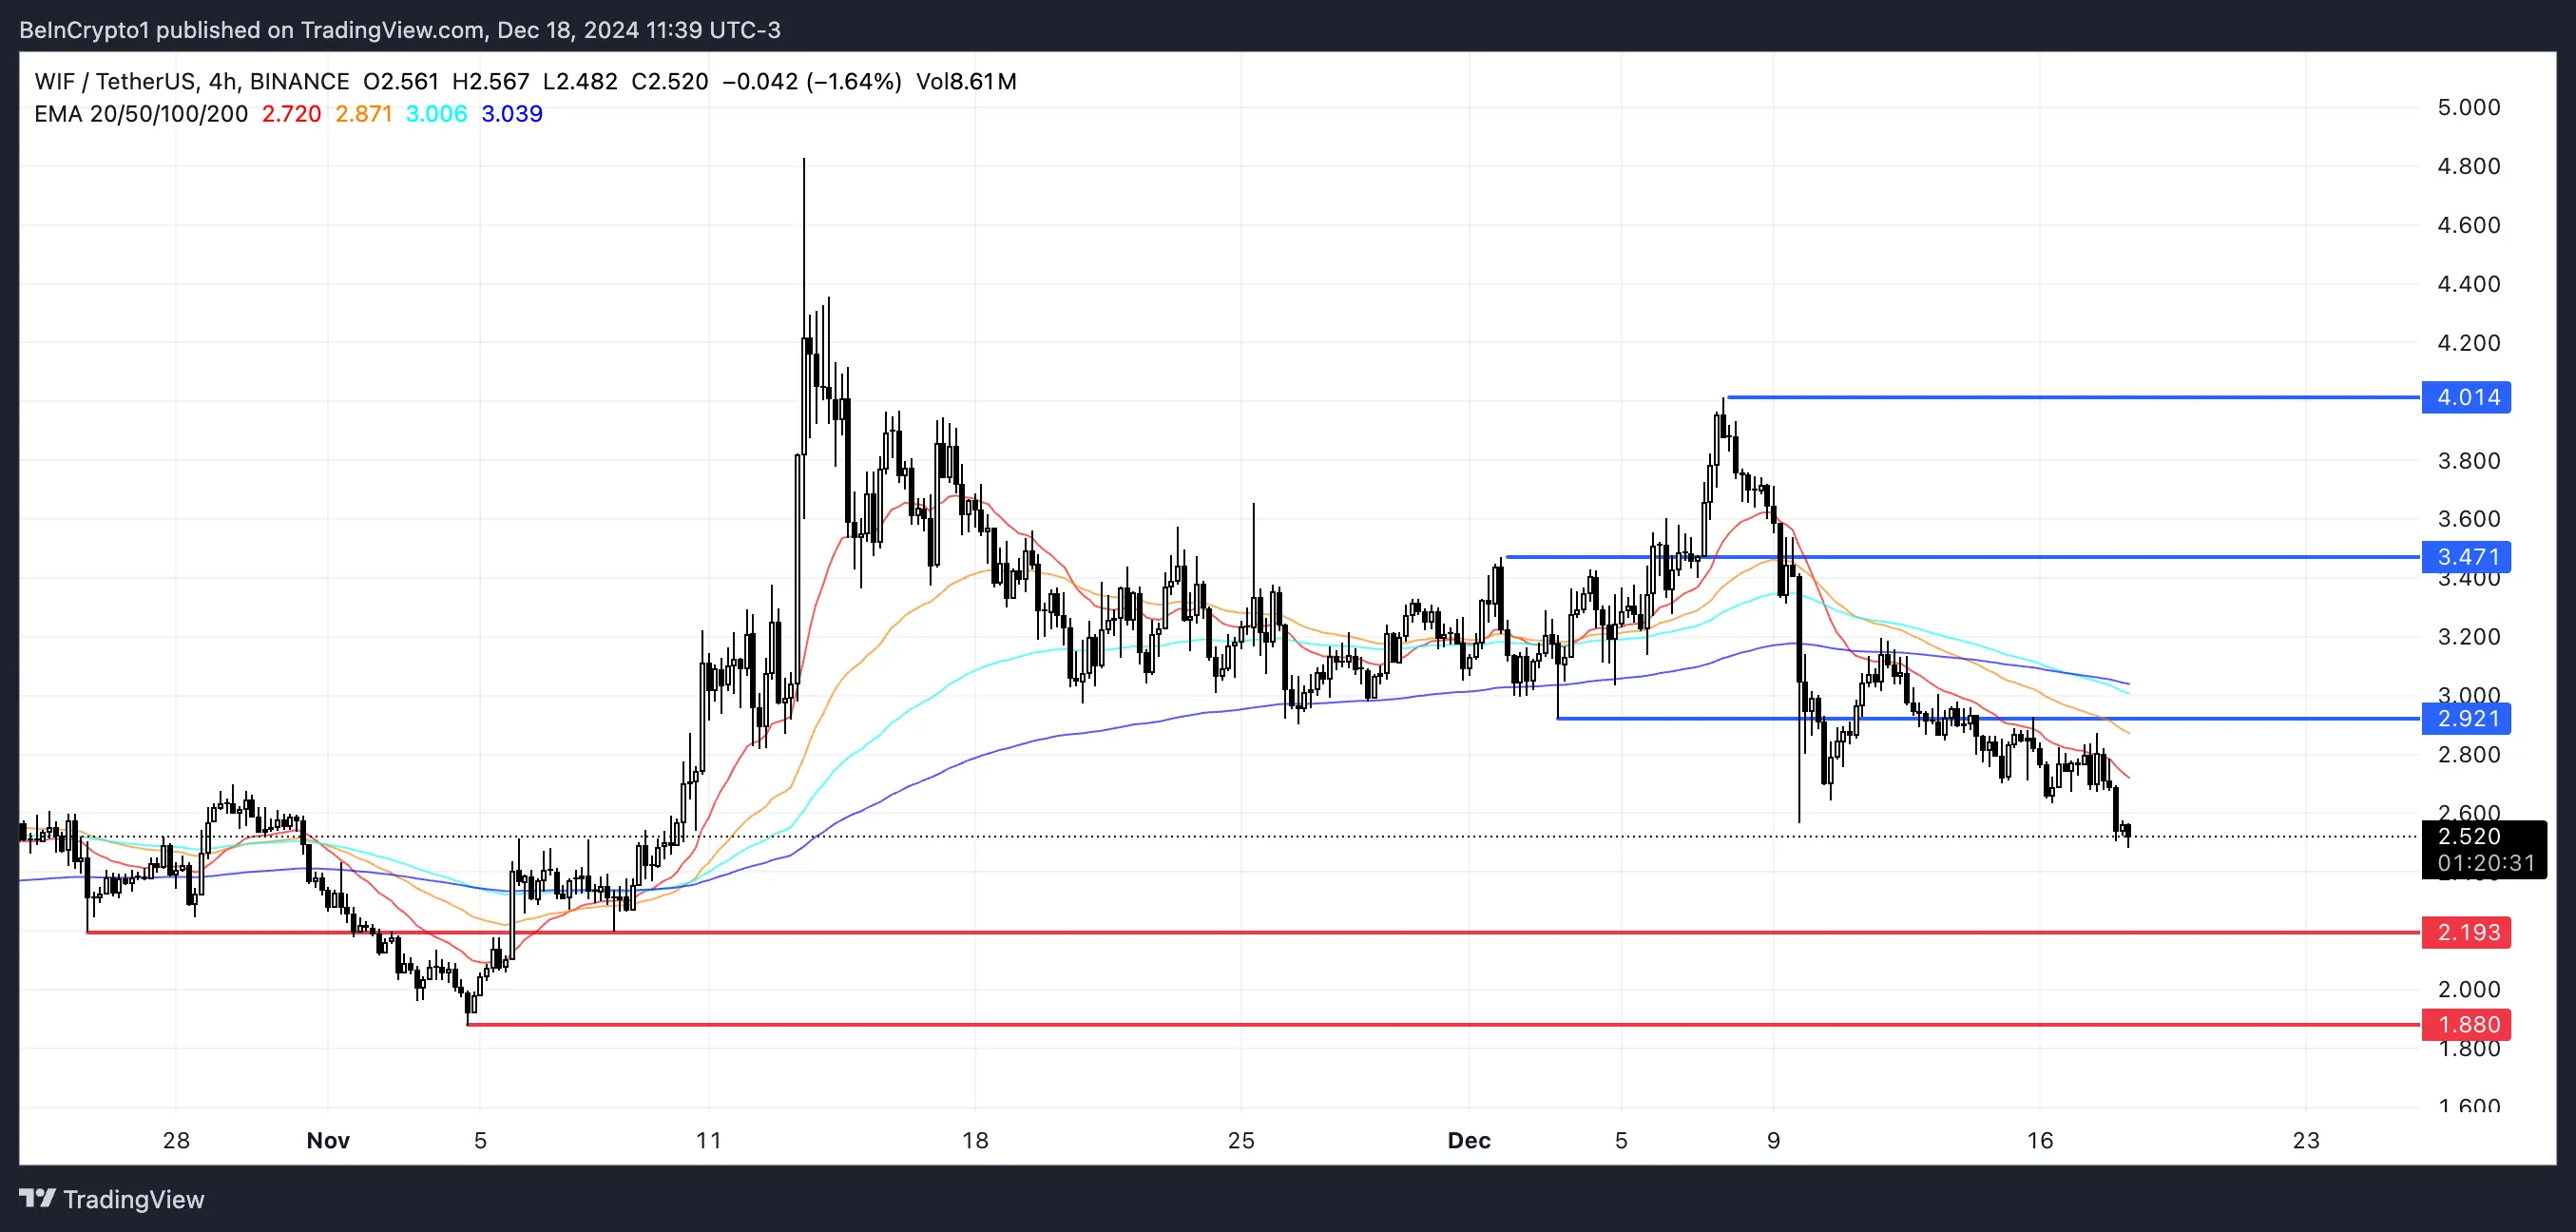
WIF’s EMAs are currently showing a bearish profile, with the short-term EMA below the long-term ones. This structure suggests continued bearish pressure, and WIF is likely to test support at $2.19.
If this level fails to hold, WIF price could fall further, potentially reaching $1.88 as the next key support.

On the other hand, if WIF price can reverse its downtrend and regain positive momentum, it could challenge the resistance at $2.91.
A successful breakout above this level could pave the way for further gains, with targets at $3.47 and possibly even $4 if the uptrend strengthens.
