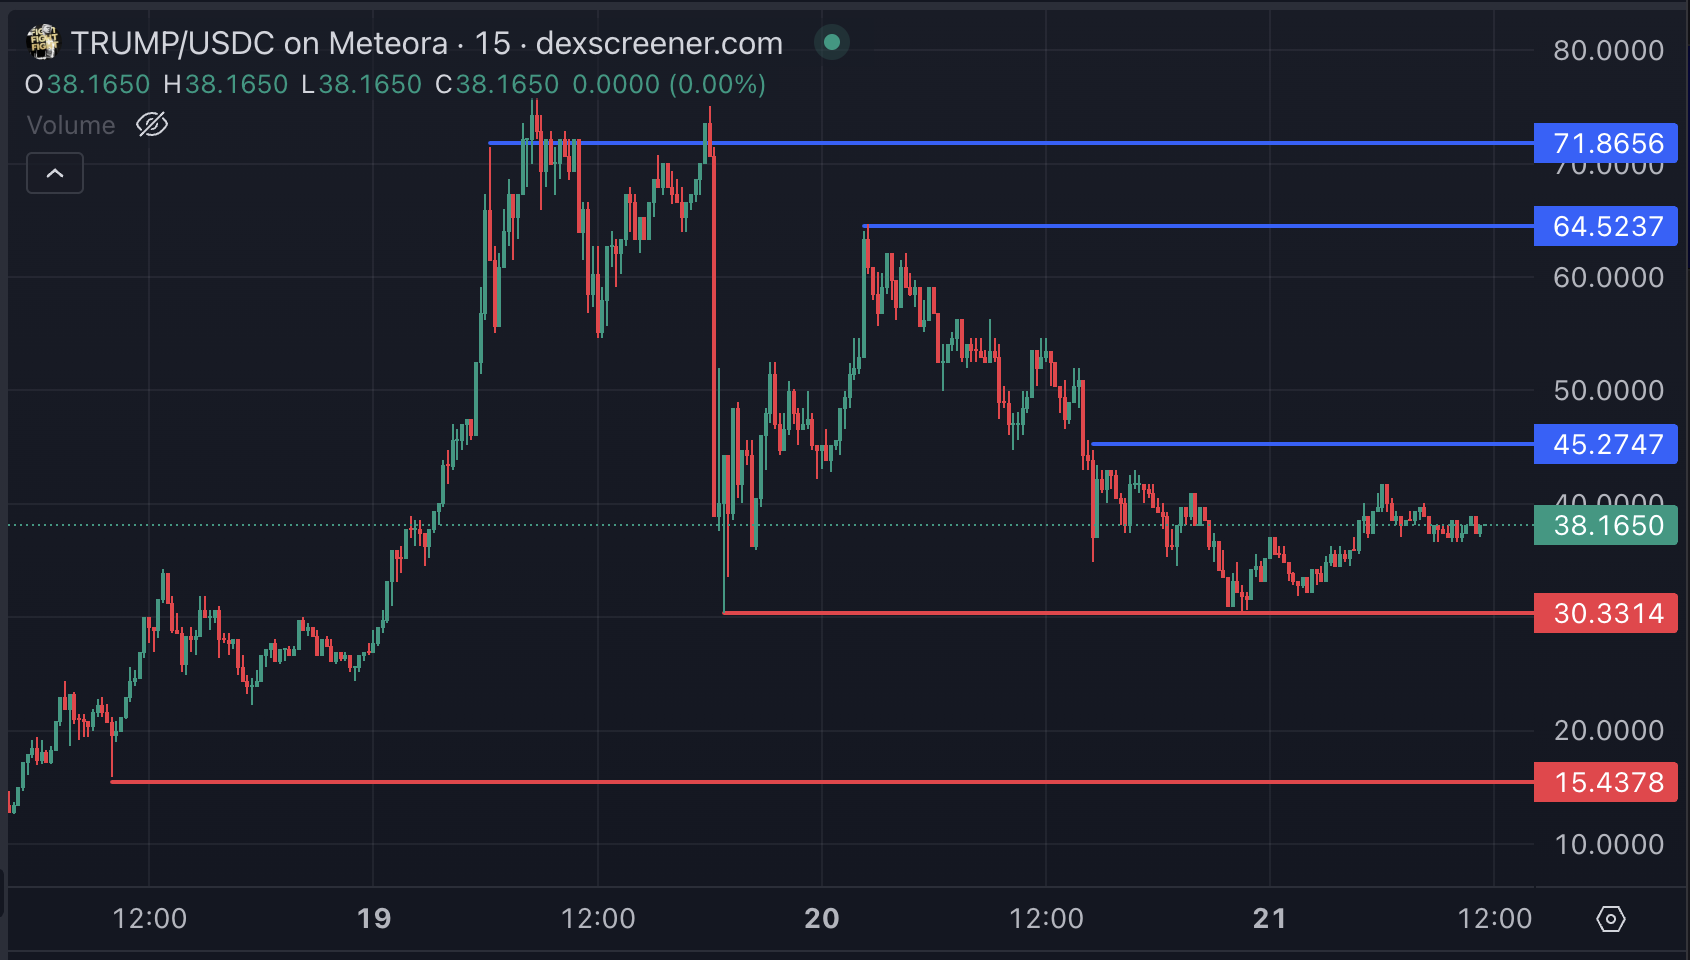
TRUMP price has dropped more than 27% in the past 24 hours, bringing the market capitalization to $7.5 billion, down sharply from nearly $15 billion just two days ago. This decline comes amid heightened volatility, as the coin is trading in a consolidation range between support at $30.30 and resistance at $45.
Although technical indicators such as RSI and ADX show neutral momentum and no clear trend, the possibility of a major breakout or breakdown remains high. If TRUMP resumes its uptrend, it could post an 88% gain to $71.80, but losing key support at $30.30 could lead to a sharp correction to $15.43.
TRUMP RSI Currently Neutral
Currently, TRUMP’s RSI reaches 46.8, up sharply from 30 just yesterday, showing a quick recovery from oversold conditions, after hitting 67 a few hours ago.
The move towards 50 suggests neutral momentum, but the Token’s positioning still requires caution as it remains below the threshold for a clearly strong uptrend.

Relative Strength Index (RSI) is a technical indicator used to measure the speed and extent of price movements to gauge market momentum. It ranges from 0 to 100, with values above 70 indicating overbought conditions, which often herald a price correction, and values below 30 signaling oversold conditions, which can indicate a possible recovery. .
At 46.8, TRUMP’s RSI reflects a neutral phase, suggesting the potential for price stabilization or gradual growth. However, the Token needs to break above 50 to signal stronger bullish momentum and strengthen confidence in a sustainable uptrend.
TRUMP ADX Shows Unknown Trend
TRUMP’s ADX is currently at 14.4, down significantly from 46 just yesterday. This sharp drop shows that the trend strength has weakened significantly, as the coin moves horizontally without a clear direction.
Low ADX levels indicate that TRUMP is experiencing reduced volatility and indecisive market behavior in the short term.

The Average Directional Index (ADX) measures the strength of a trend, regardless of direction, on a range from 0 to 100. Numbers above 25 typically indicate a strong trend, while values below 20 indicate Weak or non-existent trend. With TRUMP’s ADX at 14.4, the Token’s price movement is currently directionless, reflecting a period of consolidation.
This sideways action could set the stage for a breakout as momentum rebuilds or continue if traders are hesitant to commit to a clear trend.
TRUMP Price Prediction: Will TRUMP Continue to Edit 59% Less?
Currently, TRUMP is trading within a range defined by resistance at $45 and support at $30.30, reflecting a period of consolidation. If the token regains its uptrend and positive momentum, it could test the $45 resistance level.
A breakout above this level could open the doors to a rally to $64.50, and further strength could push TRUMP to $71.80, representing a potential 88% upside from current levels. , making it one of the top three Meme Coins on the market.

Conversely, if TRUMP price tests the $30.30 support without holding above this level, the price could face a sharp correction. A break below this support could help push the token down to $15.43, representing a potential 59% drop.
