AAVE price continues to rise, cementing its position as the largest lending protocol in the cryptocurrency market with a market capitalization of $5.5 billion—more than the combined total of all other top 10 lending protocols .
The token is up an impressive 220% this year and 110% in the past 30 days alone, driven by strong momentum and growing interest from the market. Technical indicators such as RSI and CMF show ongoing positive trends, but some signs of cooling momentum could hint at a potential correction in the future.
AAVE’s RSI Is Neutral After Nearing Overbought Area
AAVE’s Relative Strength Index (RSI) is currently 59.2, down from 69.19 on December 23, when the price peaked at $382. This drop in RSI shows that AAVE price has left the overbought level, where heavy buying pressure usually predicts a price correction.
Although the current RSI still reflects strong momentum, this decline suggests that the market may be stabilizing after a period of strong buying.

RSI is a momentum indicator that measures the speed and intensity of price movements on a scale from 0 to 100. Values above 70 indicate overbought conditions, warning of a possible correction, while values below 30 indicates oversold conditions, which often leads to a recovery.
With AAVE’s RSI at 59.2, the coin remains in the neutral to bullish range, suggesting the uptrend could continue in the short term if buying momentum rebuilds. However, the pullback from overbought levels also suggests that AAVE price could consolidate, allowing the market to absorb recent gains before deciding on its next direction.
AAVE’s CMF Remains Very Positive, But Down From Recent Peak
AAVE’s Chaikin Money Flow (CMF) is currently at 0.17, maintaining a positive trend from December 23, when it peaked at 0.27. This shows that AAVE is continuously experiencing strong capital inflows, reflecting strong buying pressure in the market.
Although CMF has declined from its recent peak, this positive value shows that buyers remain in control, albeit with slightly reduced intensity.

CMF is a volume-weighted indicator that measures the accumulation or distribution of an asset over a specific period, ranging from -1 to +1. Positive CMF values indicate accumulation and buying pressure, while negative values indicate distribution and selling pressure.
With AAVE’s CMF at 0.17, positive inflows suggest the token could hold current price levels or even continue to rise in the short term if trading activity sustains. However, the decline from the December 23 peak indicates that momentum may be cooling, leading to a period of consolidation before any drastic moves.
AAVE Price Forecast: Can AAVE Hit Its Highest High in 3 Years?
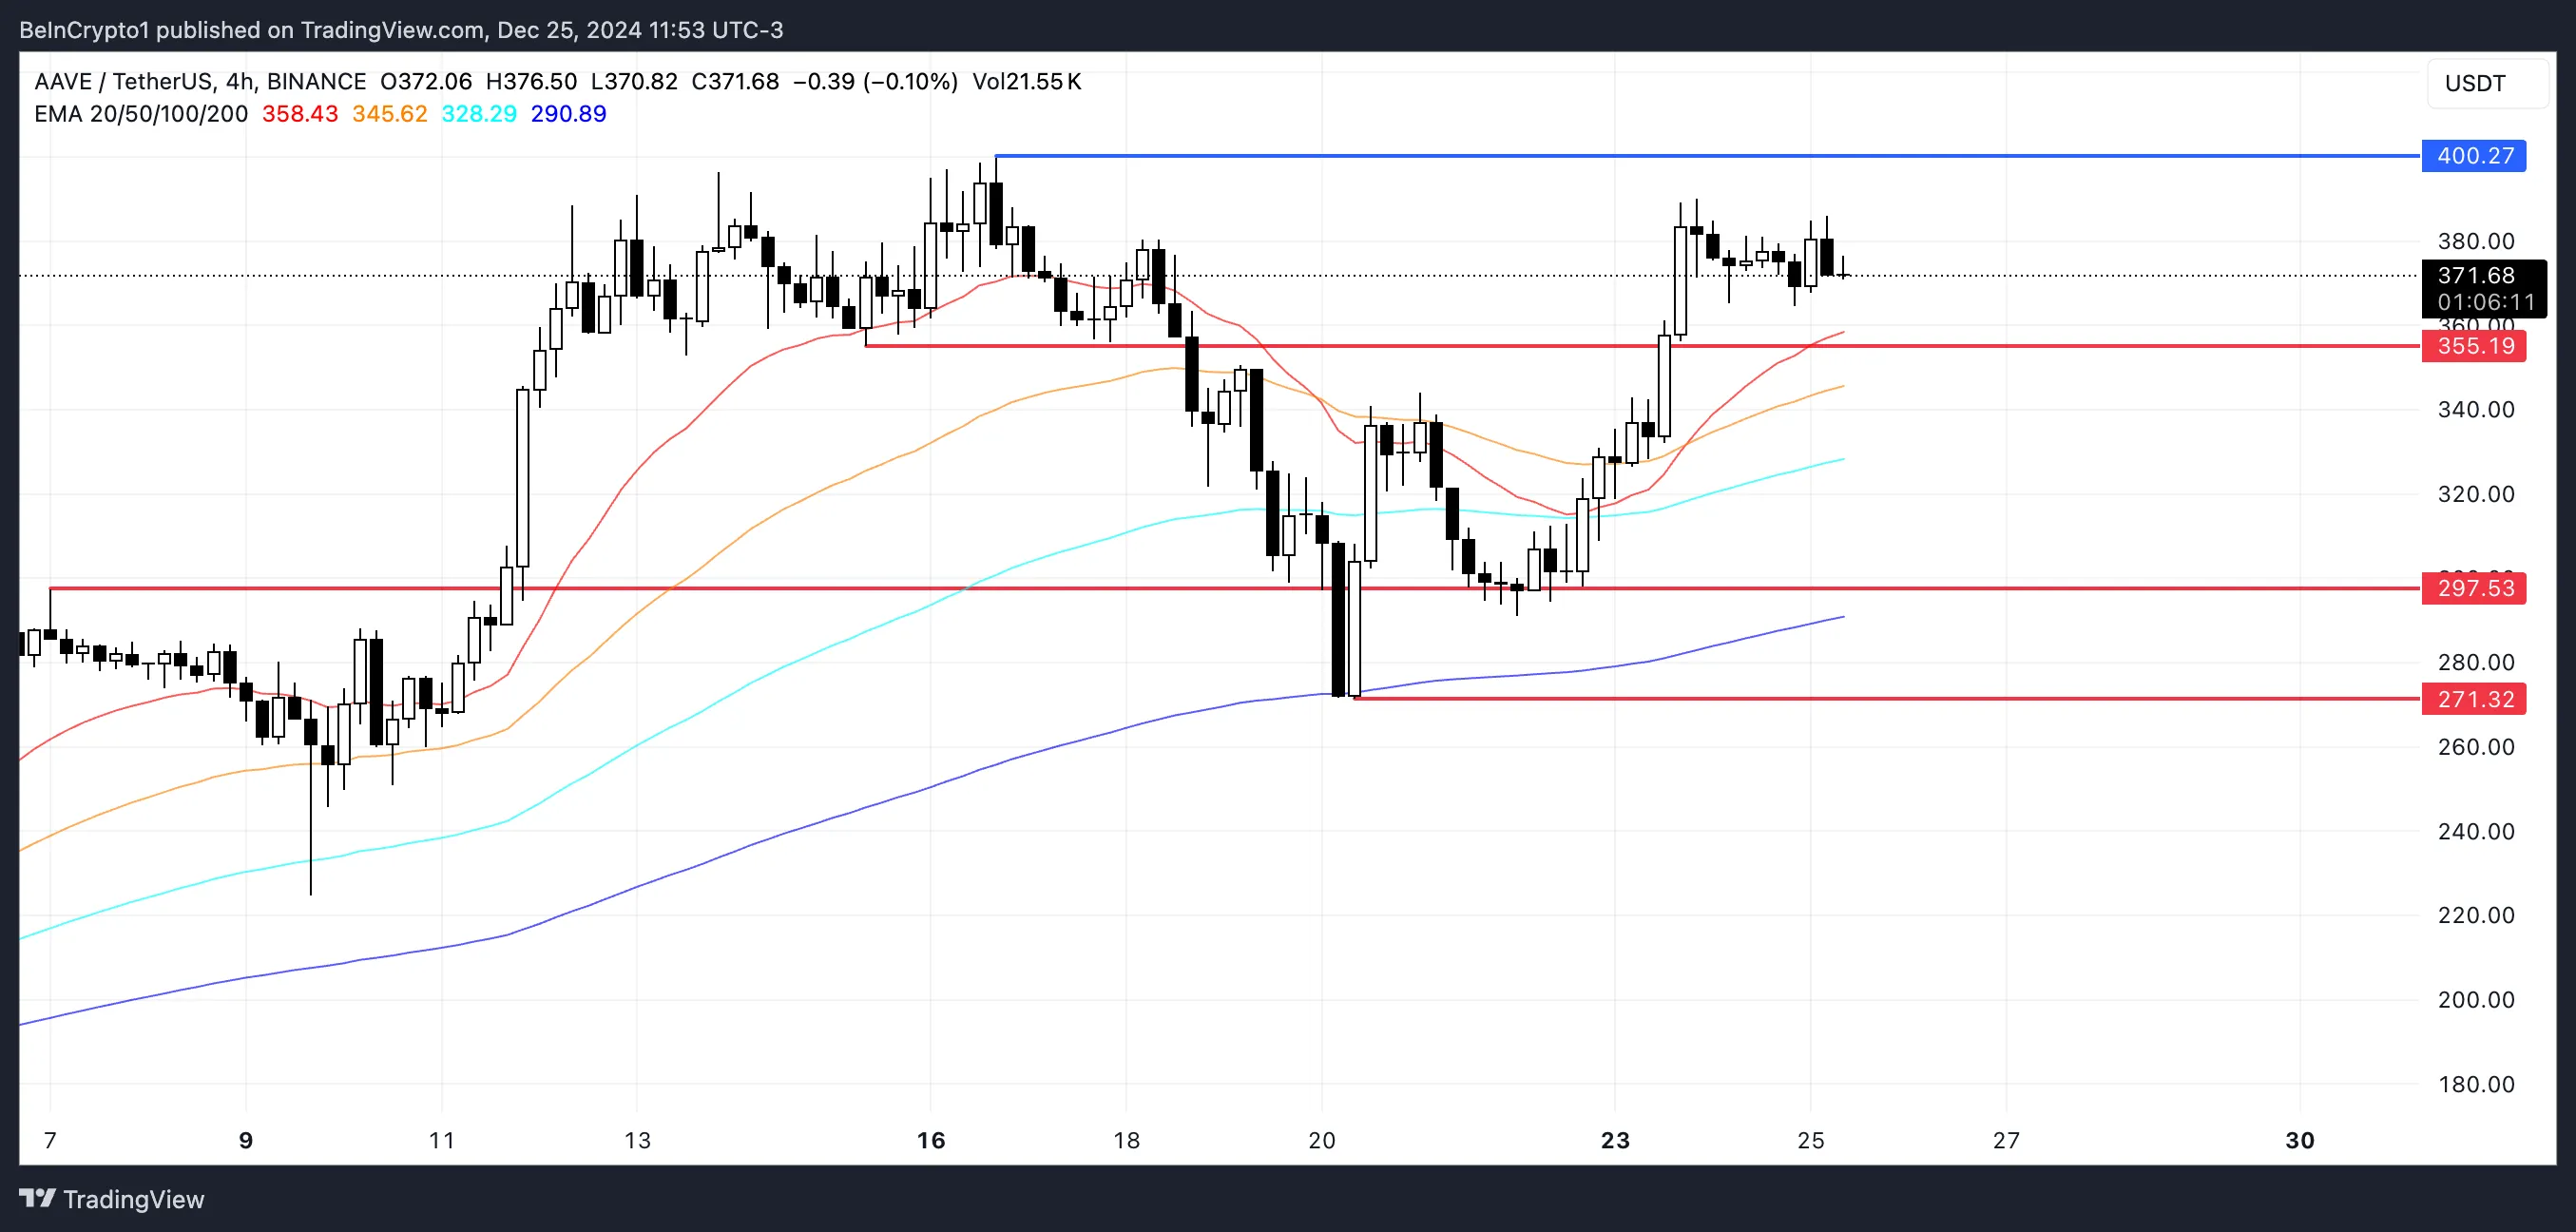
If the current positive momentum continues, AAVE price could challenge $400, a key level that would mark its highest price since 2021. The token only needs to increase 7.5% to reach this milestone, which is Supported by the gold swing formation on December 23, the EMA indicates that the uptrend may continue.
This arrangement of technical indicators suggests that bullish sentiment remains strong, with buyers likely to push prices higher if the trend holds.

However, as indicated by CMF, the strength of the uptrend has weakened compared to the past few days, indicating the possibility of a trend reversal. If the AAVE price trend loses momentum, the price could decline to test the $355 support.
If this support fails, AAVE could see further declines, with potential targets at $297 or even $271, reflecting a significant correction.
