
The cryptocurrency market has seen a strong rally in recent days with the number of digital assets surging. Moreover, with the global market capitalization surpassing the $2.10 trillion mark, the price of Bitcoin has returned to around $60,000.
Following that, top tokens like Ethereum and Ripple broke their key resistance levels and are on the verge of a potential breakout.
Wondering how the three oldest cryptocurrencies will perform amid the growing uncertainty in the crypto market? Don’t worry and start this article right away!
Bitcoin Price Retests $60,000 Resistance!
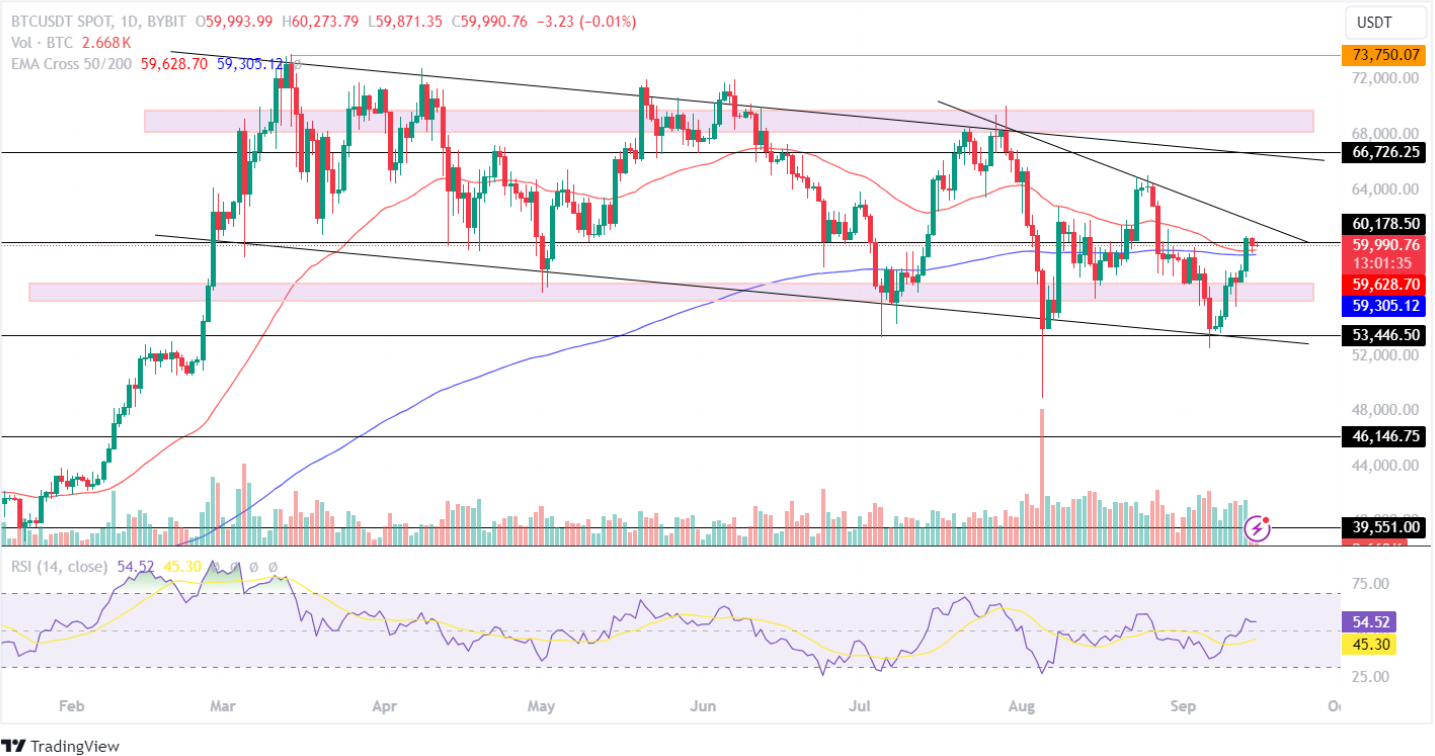
With a gain of approximately 1% over the past day, BTC price continues to hover around the $60,000 resistance/support level. However, the crypto star has added 9.91% over the past week and 2.68% over the past month. This shows a strong bullish sentiment for Bitcoin price.

The Relative Strength Index (RSI) has recorded a stable price trend on the 1-day time frame. However, the trendline shows a bullish curve. This suggests a mixed price sentiment for the Bitcoin Token.
If the market sustains BTC above the crucial $60,000 level, the bulls will regain momentum and be ready to advance to the $66,000 resistance level in the near term. On the other hand, a bearish reversal could drag the price down to the low of $58,000.
Ethereum Price Experiences Decline in Bullish Activity
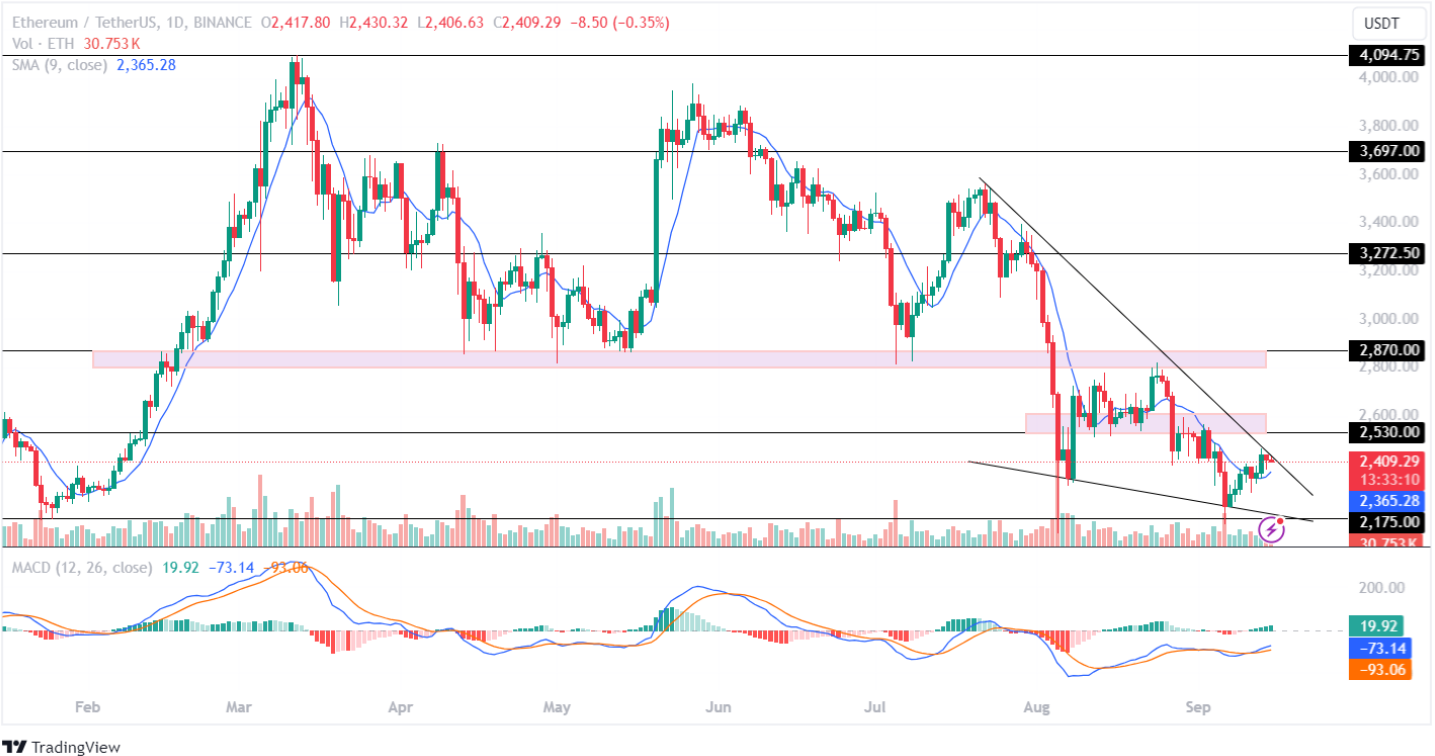
Following in the footsteps of the leader, Ethereum price has held its value above the $2.4k mark despite recording a 0.59% drop over the past day. However, the largest altcoin is on the verge of testing the resistance level in the 1-day time frame.


The Moving Average Convergence Divergence (MACD) indicator has shown a steady increase in the blue histogram with bullish signs in the moving averages. This suggests a positive outlook for Ethereum price in the coming week.
A breakout from the triangle pattern resistance could see ETH price prepare to test the $2.5k resistance. Conversely, a rejection could see it retest the key $2,175 support this month.
XRP Price Fails to Break Symmetrical Triangle Pattern!
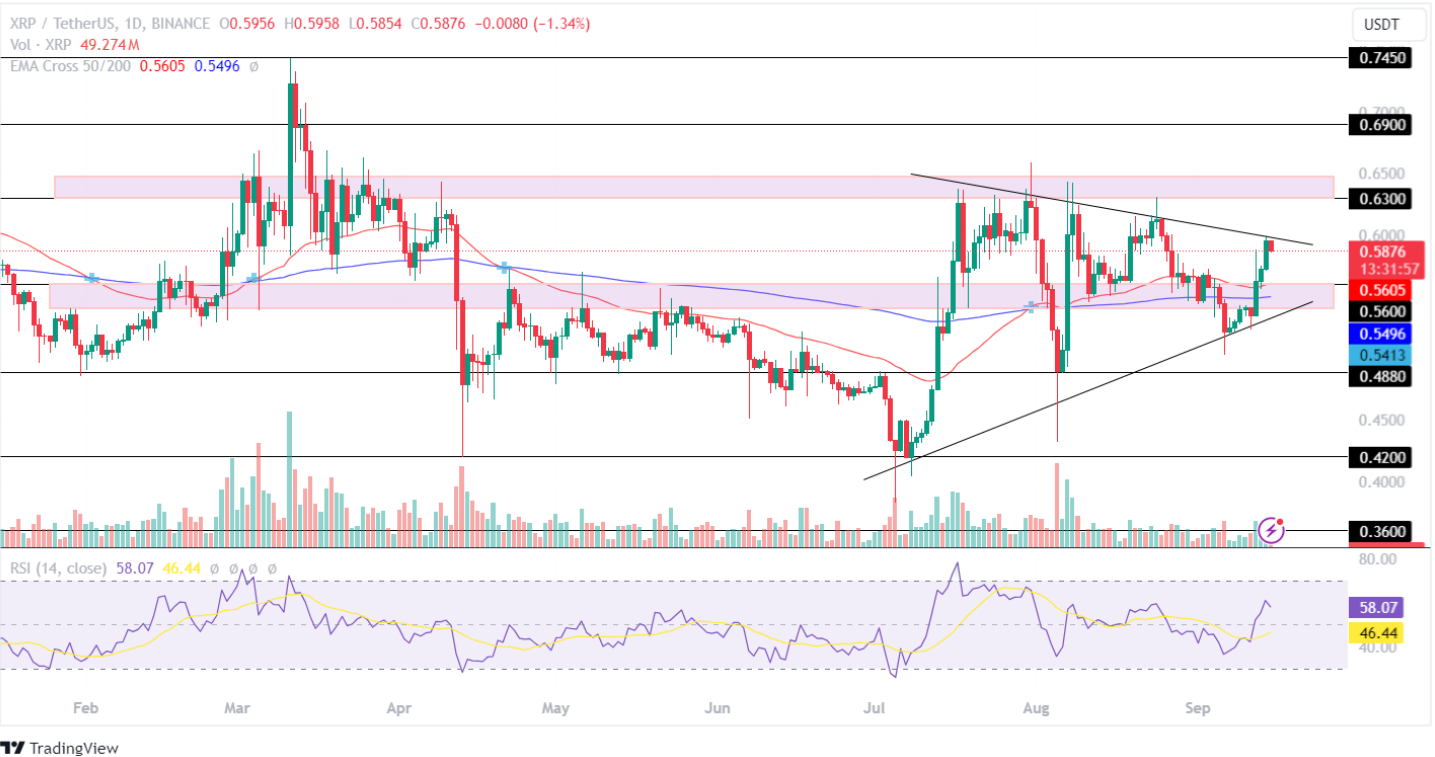
With a gain of approximately 11% over the past week, Ripple price has broken the important resistance zone of $0.56. However, it has not been able to break the resistance level of the triangle pattern. This shows a mixed price sentiment for XRP in the market.


The 50/200-day EMA has recorded a steady flat line on the 1-day time frame chart. This highlights weak buying and selling pressure for altcoins in the crypto market. Additionally, the RSI has encountered a bearish curve, suggesting increased volatility for the XRP token.
If the bulls regain momentum, Ripple price will break the resistance level and move higher to $0.630 this month. Conversely, if the bears take over, the altcoin could plunge to a low of $0.560.
