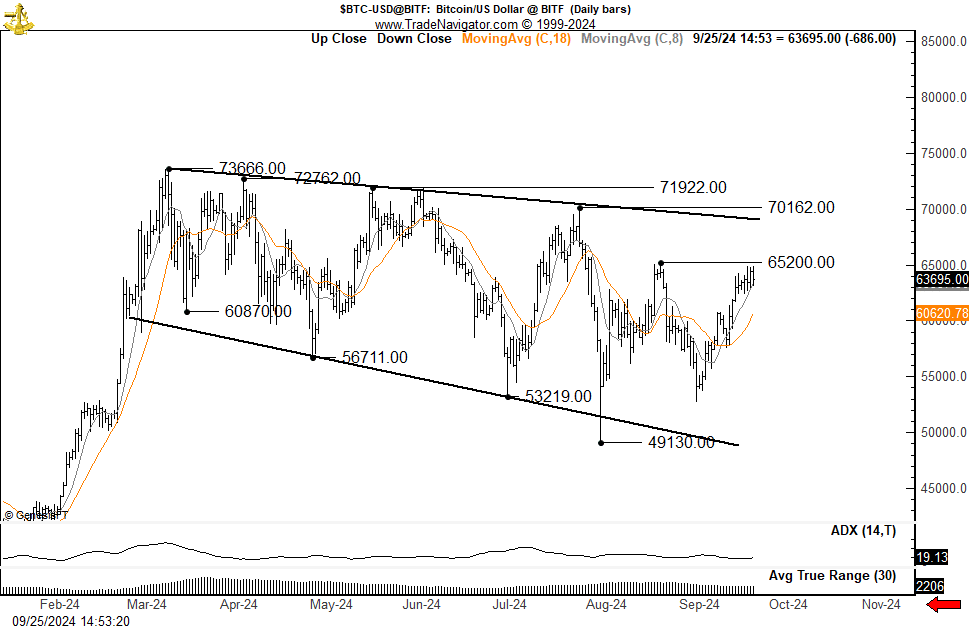
- Bitcoin’s expanding triangle pattern signals high volatility, laying the groundwork for a sharp breakout or decline.
- The MVRV ratio shows that holders are profitable, but there is still some distance to go before reaching key profit-taking levels.
Bitcoin price [BTC] continues to form an expanding triangle pattern at the present time, attracting the attention of analysts.
This pattern, characterized by an expansion of price action, suggests market uncertainty with heightened volatility.
Cryptocurrency analyst Peter Brandt noted that Bitcoin is in a Chain of lower highs and lower lows, which could continue unless the price closes significantly above the July high.
The current technical landscape could be preparing for a major breakout or risks further downside.
Expanding triangle and support levels
Bitcoin’s expanding triangle pattern reflects market uncertainty, with increasing price swings signaling higher volatility. History shows that these formations often signal strong moves, be it bullish or bearish.
Bitcoin’s lower border around $49,130 and previous lows at $53,219 are important support levels to watch. A break below these points could indicate steeper downside risks, leading to larger losses.

At the time of writing, Bitcoin is trading around the range 63,838.14 USDincreased slightly by 0.01% over the past 24 hours and increased by 2.85% over the past week.
The market is still waiting for a decisive move as the price fluctuates near key resistance levels.
Bollinger bands and momentum indicators
Price action is consolidating near the upper Bollinger band, which suggests Bitcoin is testing resistance around $63,800.
The widening of this band hints at the possibility of increased volatility, which is often observed before a significant move in the market. If Bitcoin maintains momentum above this resistance level, it could signal a continuation of the uptrend.
Conversely, failure to maintain this level could lead to a pullback to the mid-band near $60,355.
Momentum indicators such as MACD show a bullish trend, with the MACD line above the signal line and in the positive zone.
However, the bearish histogram bars show that the upward momentum is slowing, warning traders to be cautious.
A bearish crossover signal can be an early warning of a reversal, requiring these technical signals to be watched carefully.
The Relative Strength Index (RSI) is currently around 61, showing that Bitcoin is in growth territory but not yet overbought.
This suggests there is still room for prices to continue rising before reaching overbought conditions, which often leads to profit taking.
If RSI breaks above 70, traders could see an increase in selling pressure, potentially leading to a pullback in prices.
Bitcoin nearing peak profits?
On-chain data shows that Bitcoin’s MVRV ratio is 2.01, reflecting a market value of twice its real value.
This ratio is increasing, indicating that holders are increasingly profitable, which could lead to selling if the ratio continues to climb.
However, with MVRV still below its 52-week high of 2.75, there is still headroom before key historical profit-taking levels are reached.