Since the price of Bitcoin (BTC) surpassed the $100,000 mark and reached a new record high, there has been speculation that the cryptocurrency may have reached the top of this cycle. However, many key Bitcoin indicators show that this view is rooted in personal opinion and is not supported by historical data.
At press time, BTC is trading at $101,449. This on-chain analysis explains why the coin’s price may still have room to grow despite recent consolidation.
Bitcoin Continues in Growth Phase
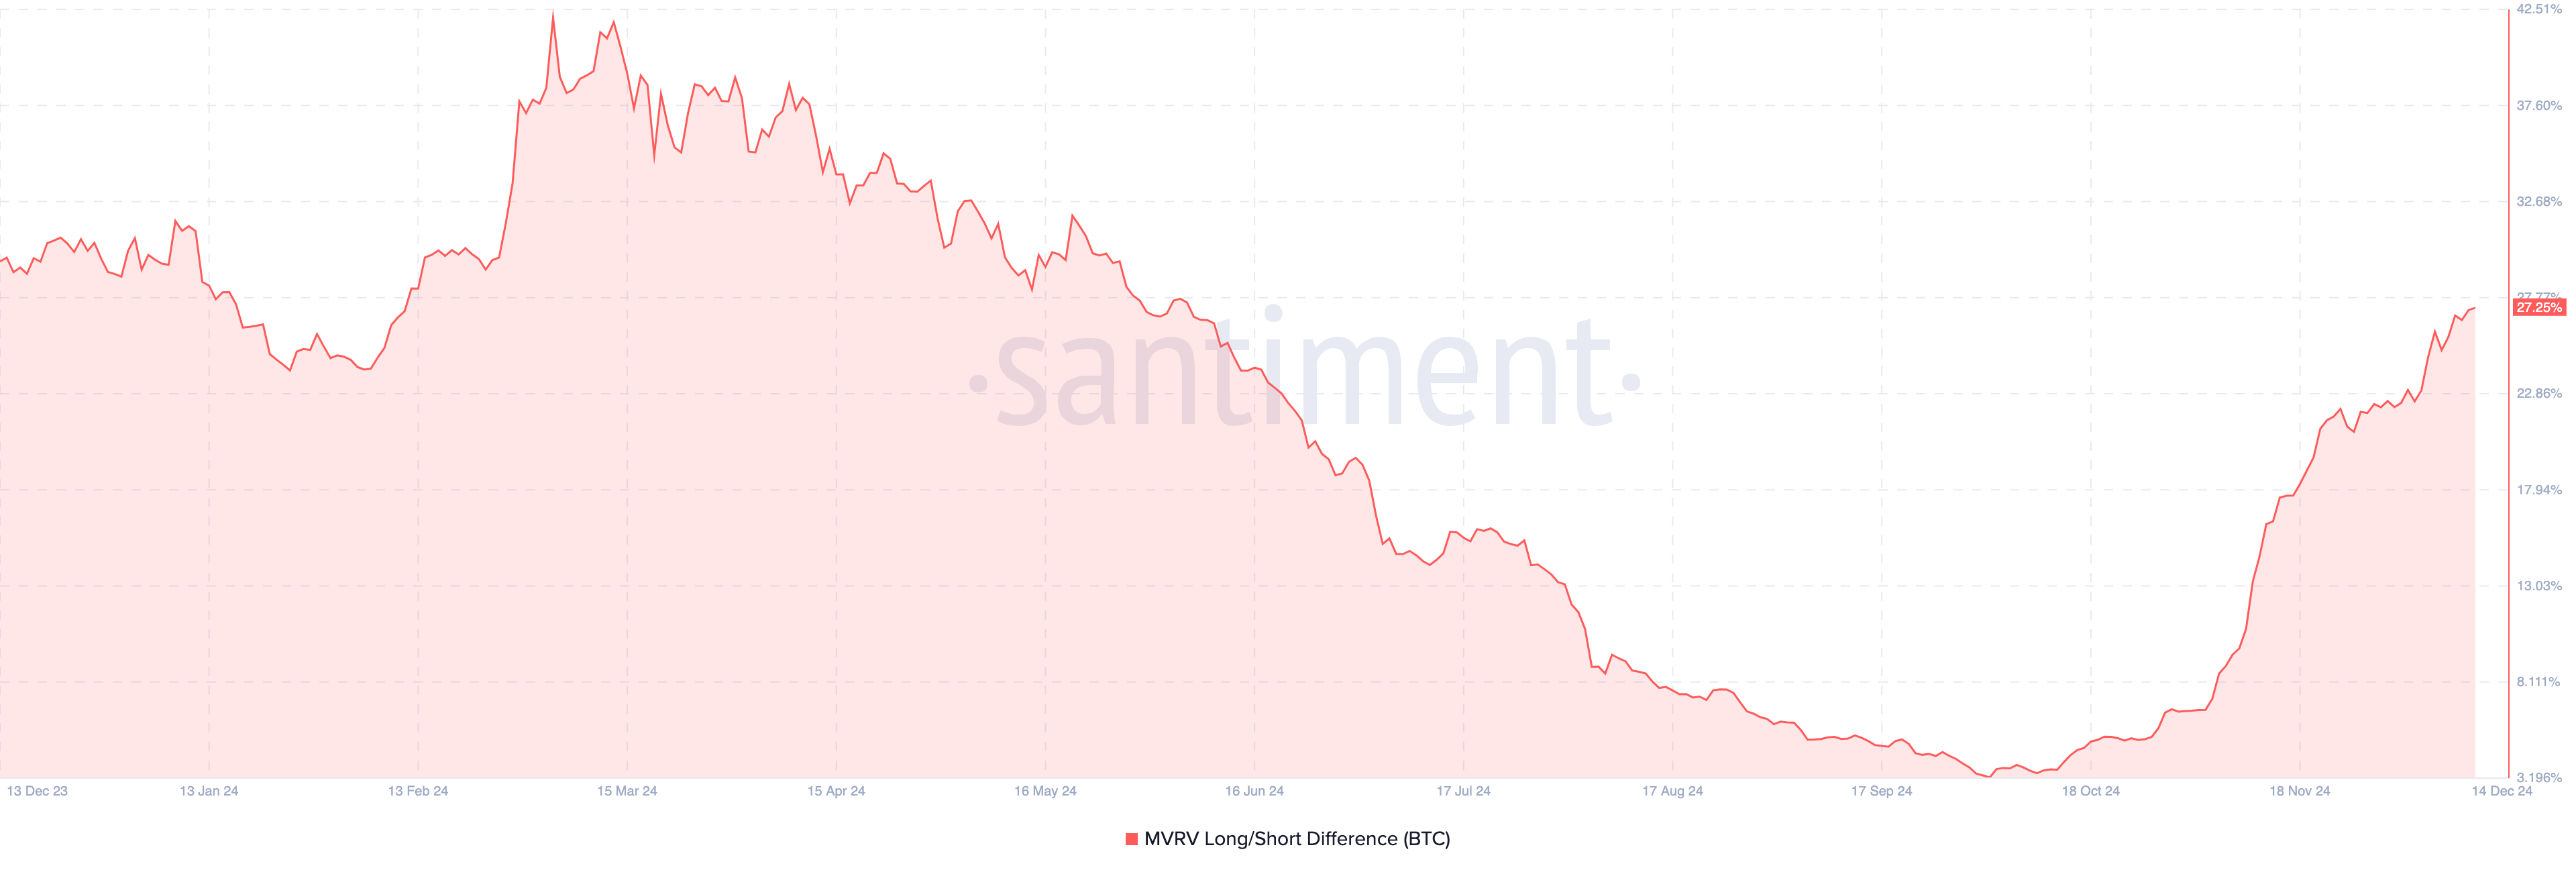
A key indicator that suggests that the Bitcoin price could continue to rise is the long/short Market Price Realized (MVRV) spread. According to historical data, this indicator shows when BTC is in a bullish phase or has entered a bearish phase.
When the long/short MVRV difference is in the positive zone, it indicates that long-term investors have more unrealized profits than short-term investors. This in terms of price is positive for Bitcoin. Conversely, when the index is negative, it shows that short-term investors prevail, and in most cases it signifies a bearish period.
According to Santiment, Bitcoin’s long/short MVRV spread has increased to 27.25%, indicating that the current cycle is a Bitcoin bull market. However, this reading is a far cry from the 42.08 it reached in March before undergoing months of consolidation and correction. According to historical data, this current condition suggests that BTC is likely to surpass its all-time high before peaking this cycle.

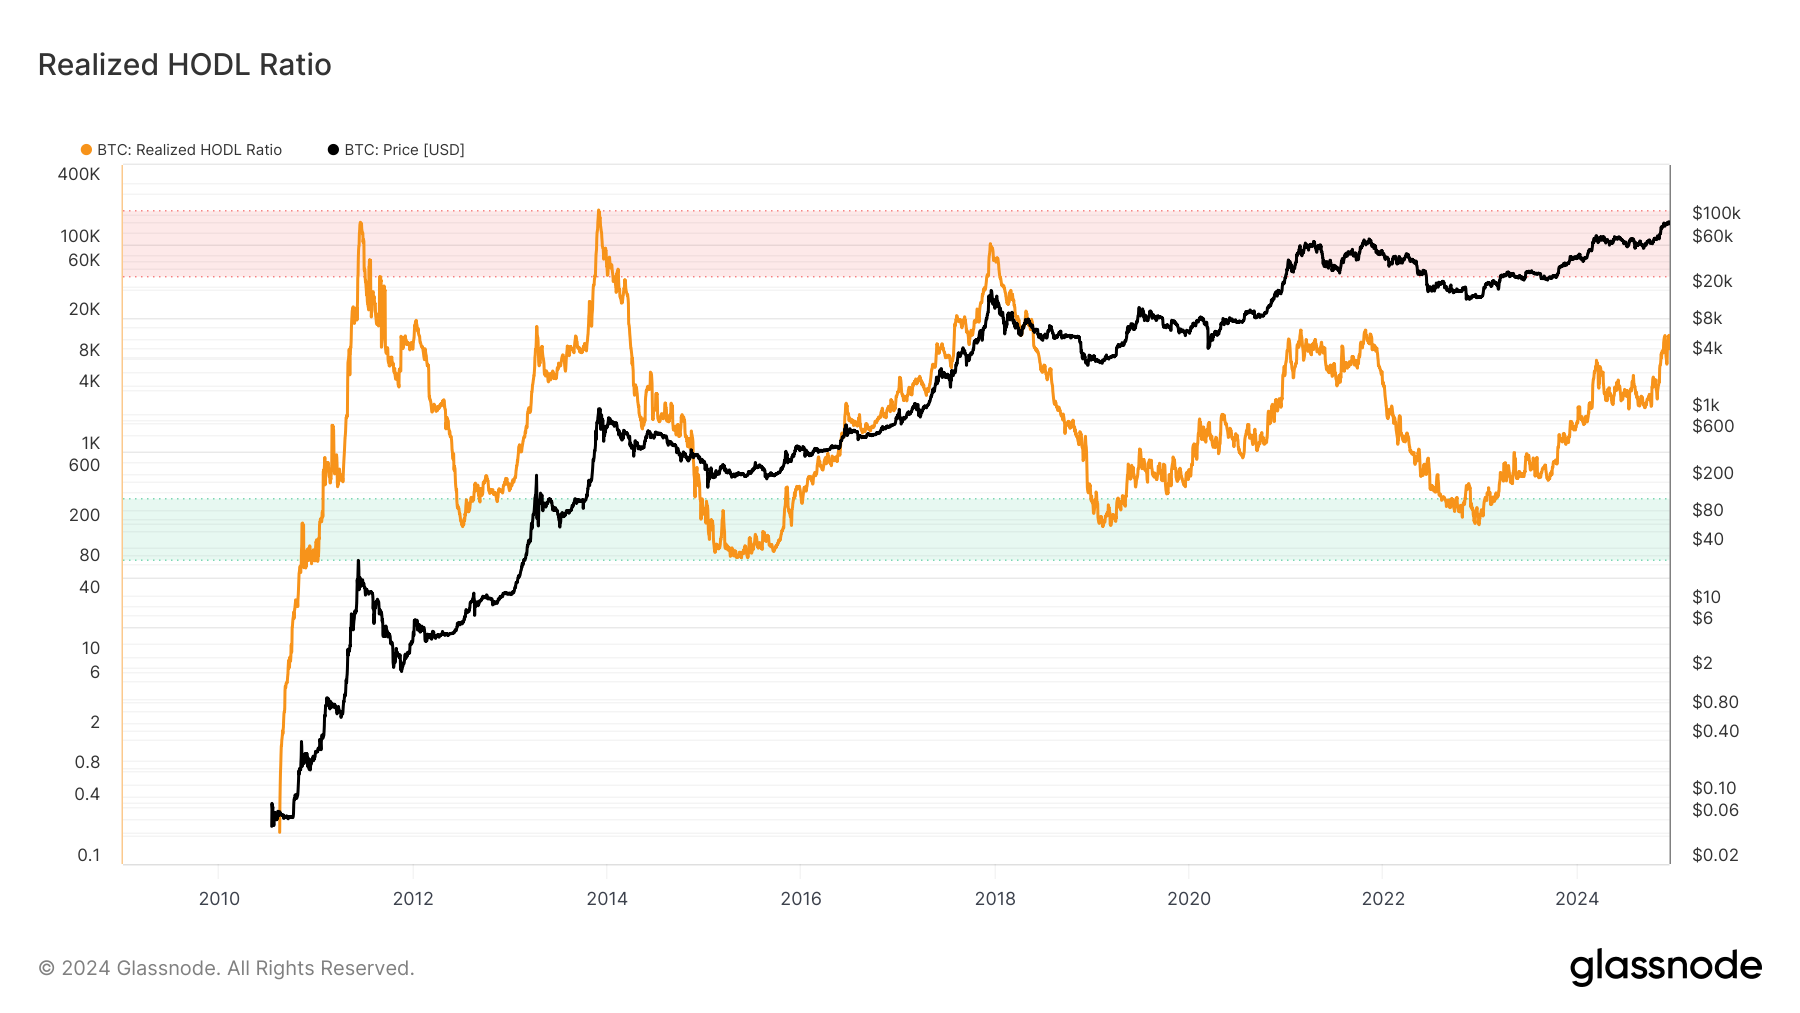
The Realized HOLD ratio, commonly known as the RHODL ratio, is another important Bitcoin metric that supports this view. The RHODL ratio is a reputable market indicator designed to analyze Bitcoin’s market bottoms and tops.
A high RHODL ratio indicates that the market is caught up in excessive short-term activity, which is often used to indicate cycle tops or upcoming corrections. Conversely, a low RHODL ratio indicates a strong long-term holding sentiment, implying that the market is undervalued.
Based on Glassnode data, Bitcoin’s RHODL ratio is above the green zone, indicating that it is no longer at the bottom. At the same time, it is below the red zone, indicating that the BTC price has not yet peaked. If this situation holds, Bitcoin could rise above its all-time high of $103,900.

BTC Price Forecast: Coin Likely to Gain Higher Value
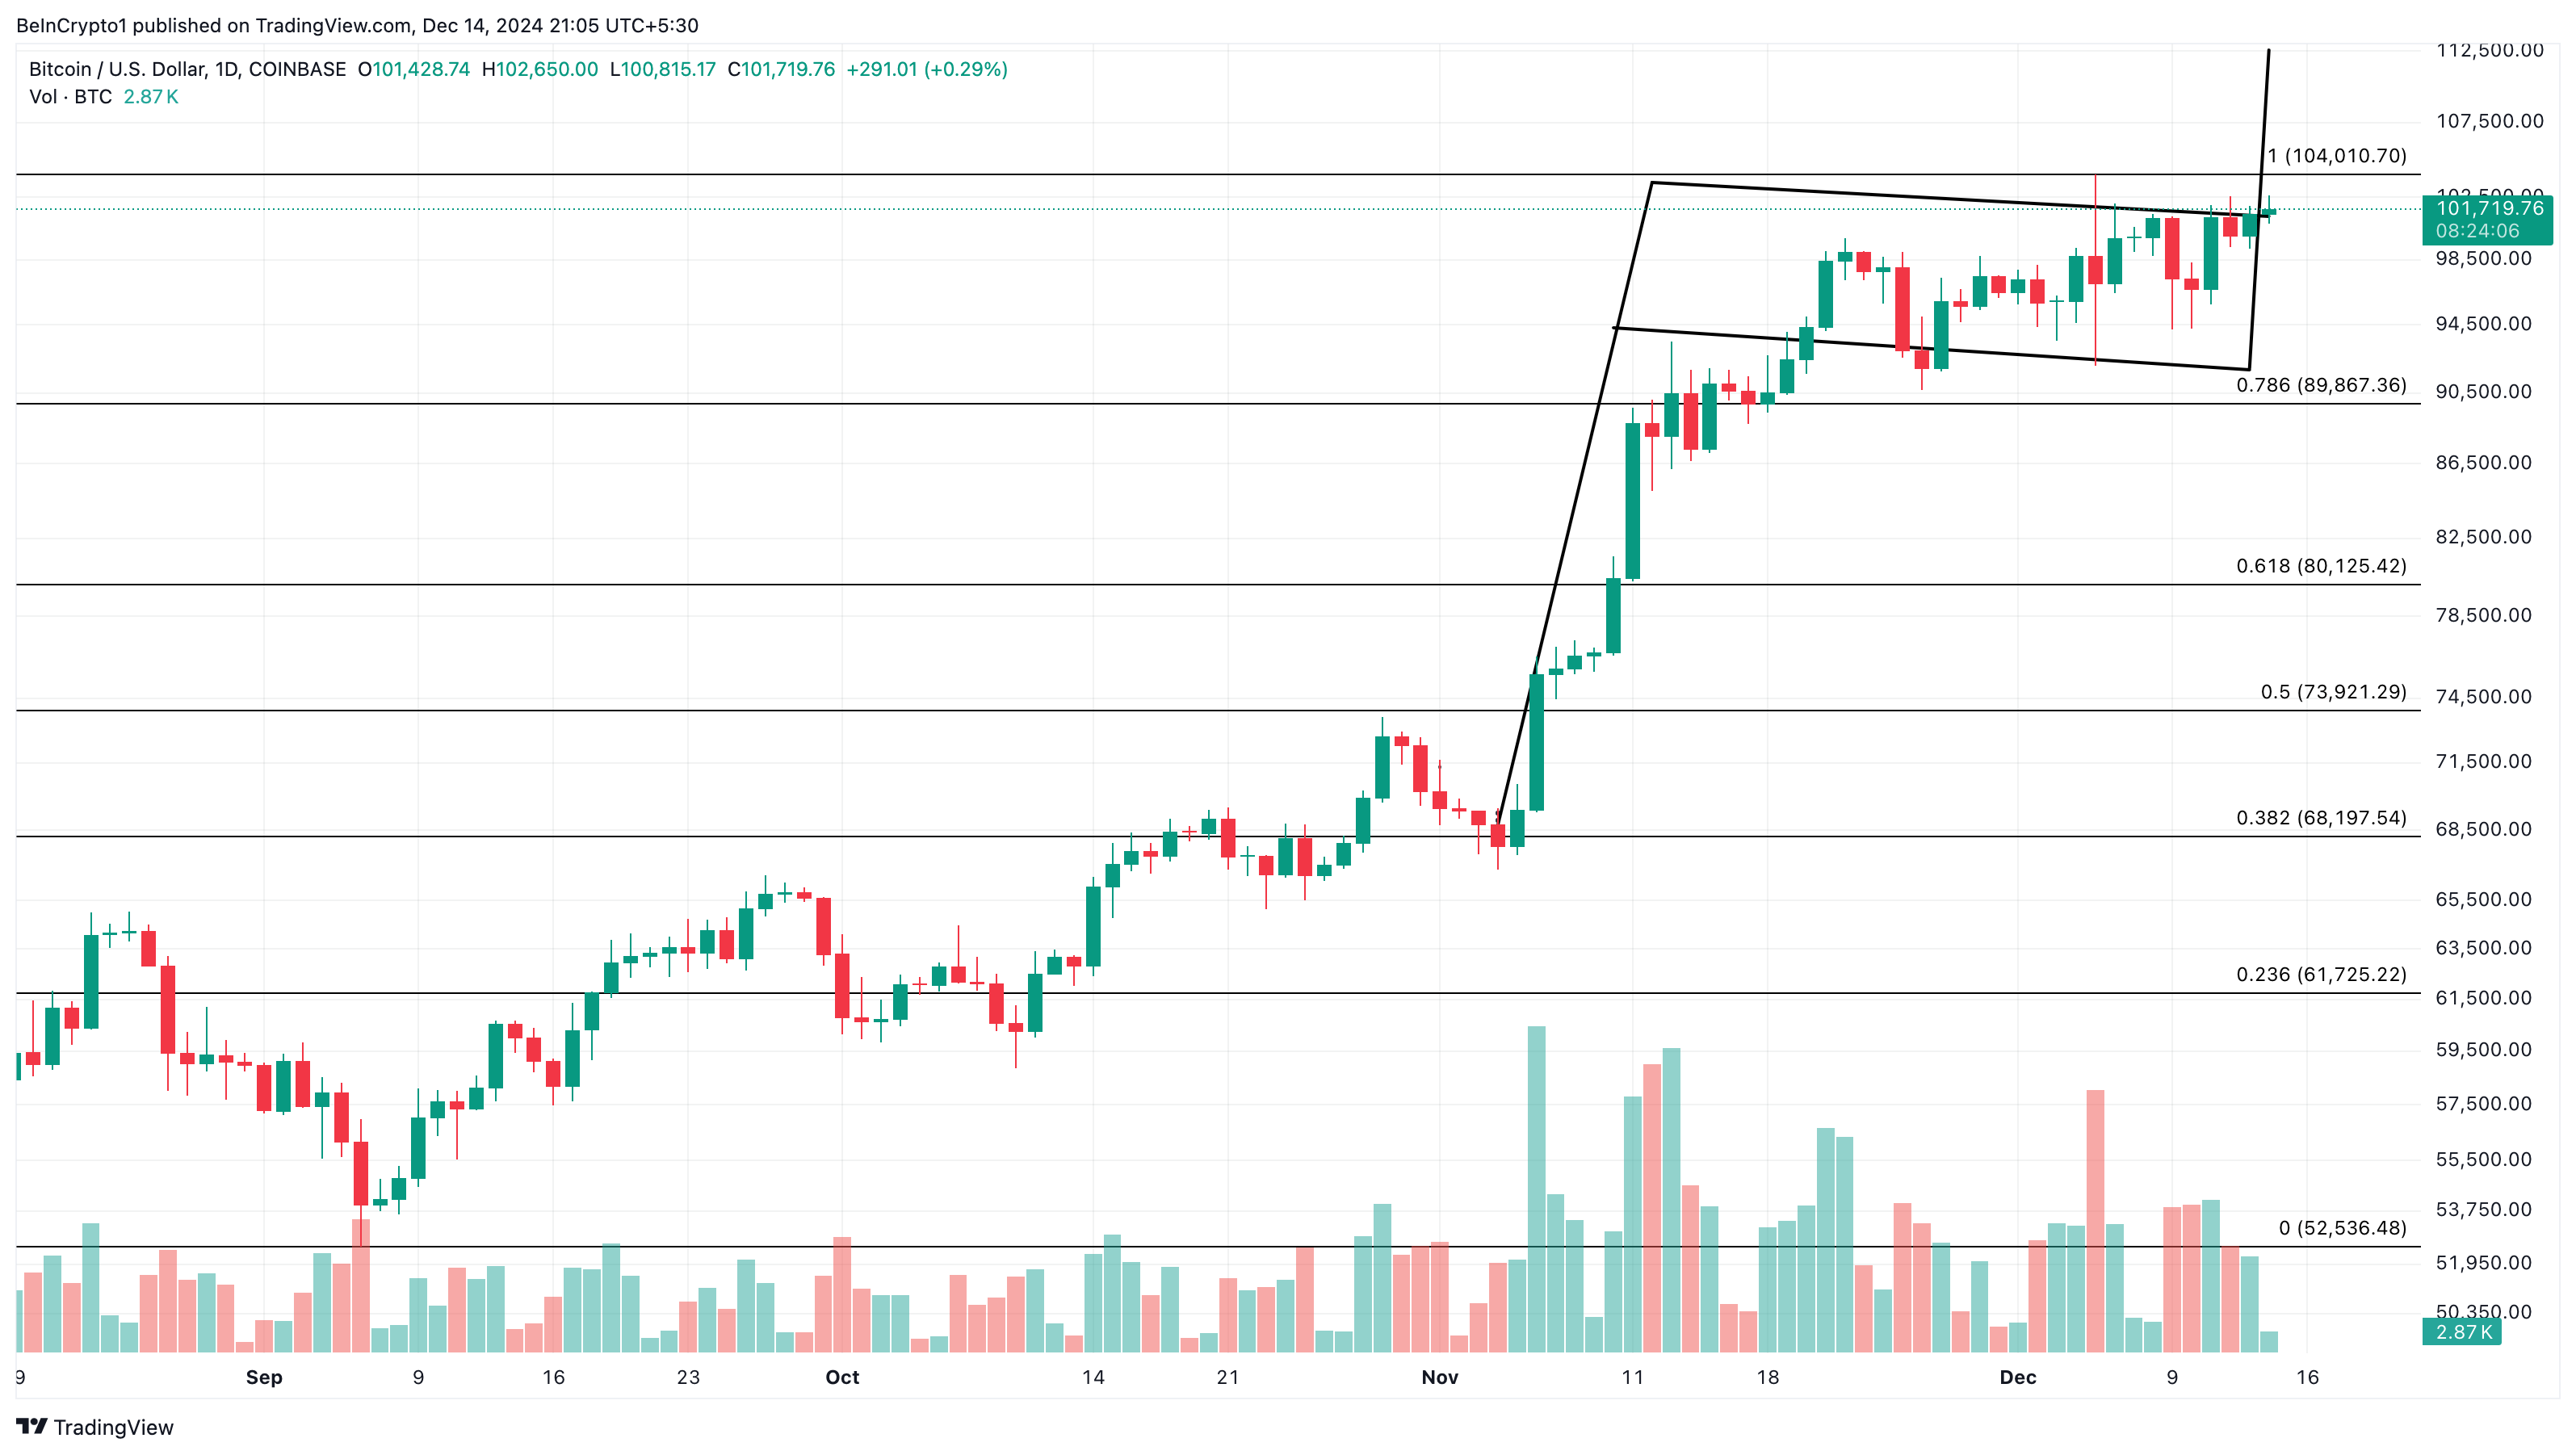
A look at the daily chart shows that Bitcoin has formed a bullish flag pattern. A bull flag is a technical pattern that indicates a possible continuation of an uptrend. The pattern shows a flagpole, indicating a strong initial price move to the upside.
The uptrend at this time indicates strong buying and high trading volume. However, this pattern is followed by a horizontal or downward consolidation near the high point of the initial move. This is called a flag and has the shape of a rectangle or a triangle, formed from slightly higher levels and lower levels.
Bitcoin appears to have crossed the upper boundary of the flag. With this position, the value of the cryptocurrency can increase to 112,500 USD.

However, if the BTC price falls below the lower boundary of the flag, this forecast may not be valid. It could also happen if major Bitcoin indices turn bearish. In that case, the value could slide down to $89,867.
