


Bitcoin November 2026: Key Price Levels and On-Chain Signals
Bitcoin price analysis for November 2026 — key support and resistance, options market positioning, whale exchange flows, and macro catalysts to watch.

Bitcoin enters November 2026 with a specific set of on-chain and macro conditions that differ from prior Novembers. This analysis covers the key technical levels, on-chain data signals, derivatives market positioning, and macro catalysts that define the November 2026 trading environment.

October 2026 close context: Bitcoin closed October 2026 at approximately $87,400, representing a recovery from the Q4 2025 drawdown low of $58,200 but still approximately 30% below the 2025 cycle peak of $126,000. The October close marked the fifth consecutive month of price recovery.
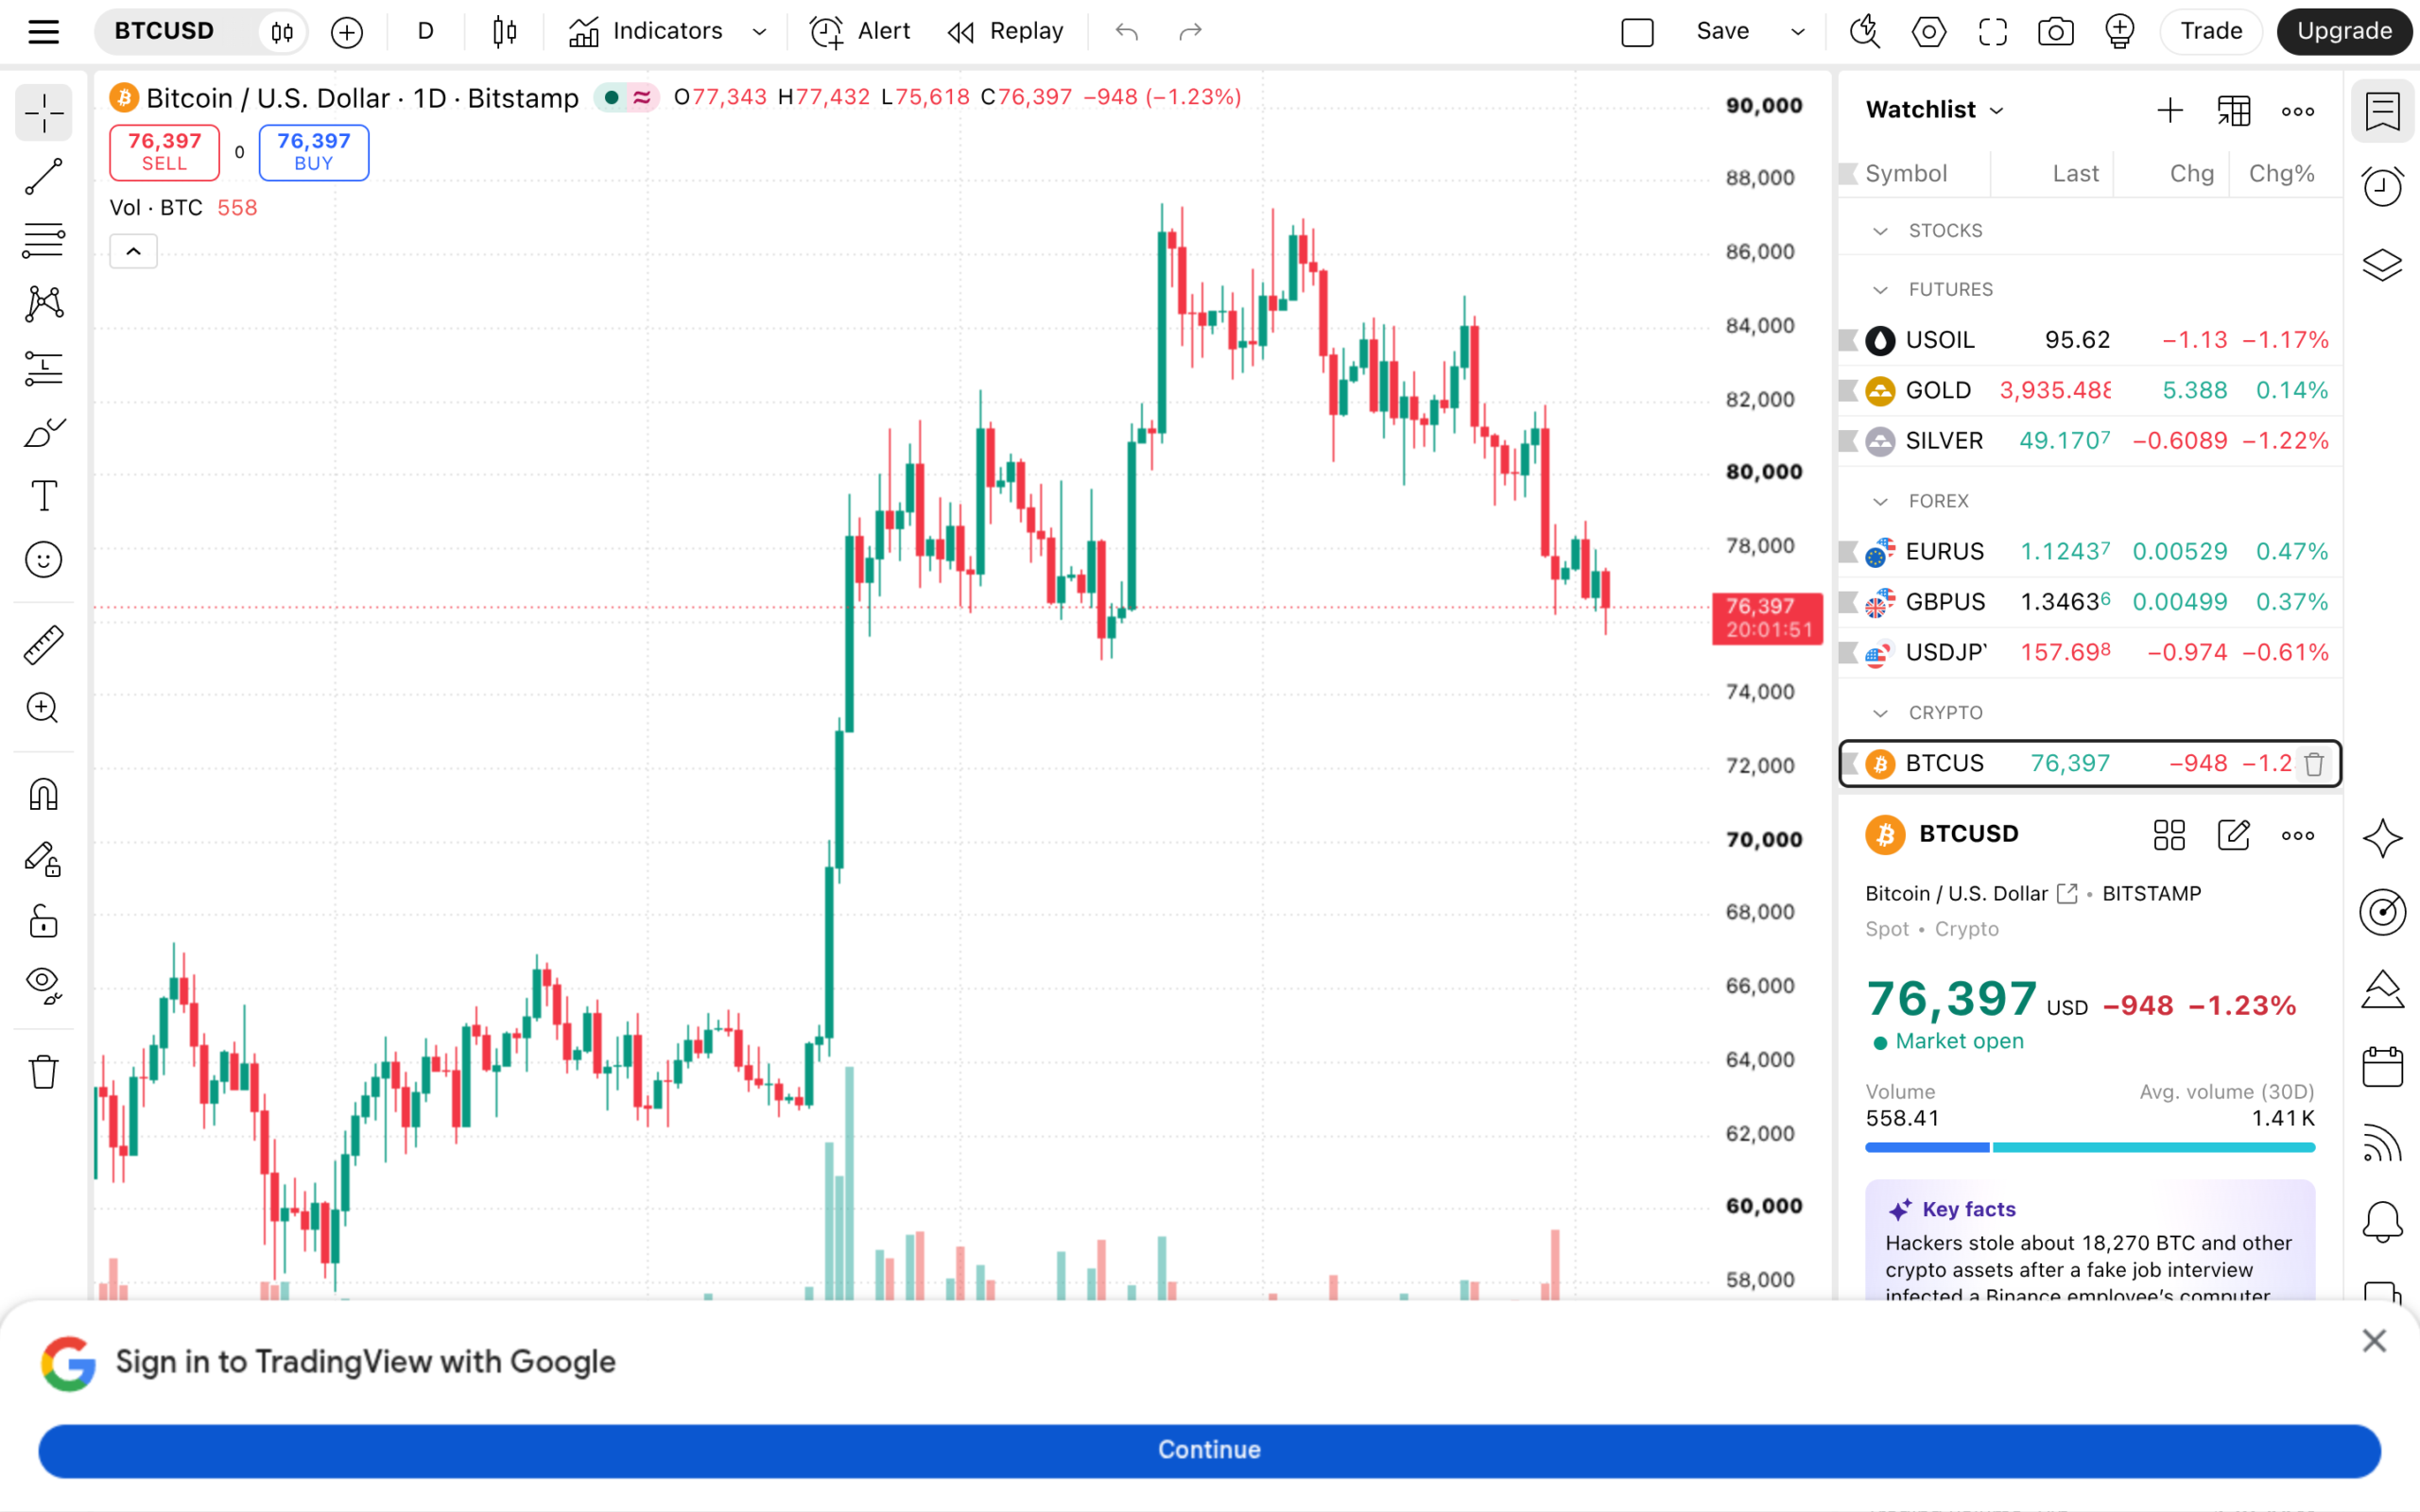
Key support and resistance levels for November
Resistance:
- $92,000–$94,000: Prior consolidation zone from June 2026; multiple failed breakout attempts
- $98,000–$100,000: Psychological round number + 2025 peak retest zone + heavy options OI concentration
- $108,000–$112,000: 2025 cycle peak area; long-term resistance if $100K is reclaimed
Support:
- $84,000–$85,000: October 2026 consolidation base; first meaningful demand zone below current price
- $78,000–$80,000: June–July 2026 accumulation range; significant on-chain cost basis concentration
- $72,000–$74,000: Q2 2026 low area; would constitute a significant technical breakdown if reached
Options market: what derivatives are pricing in
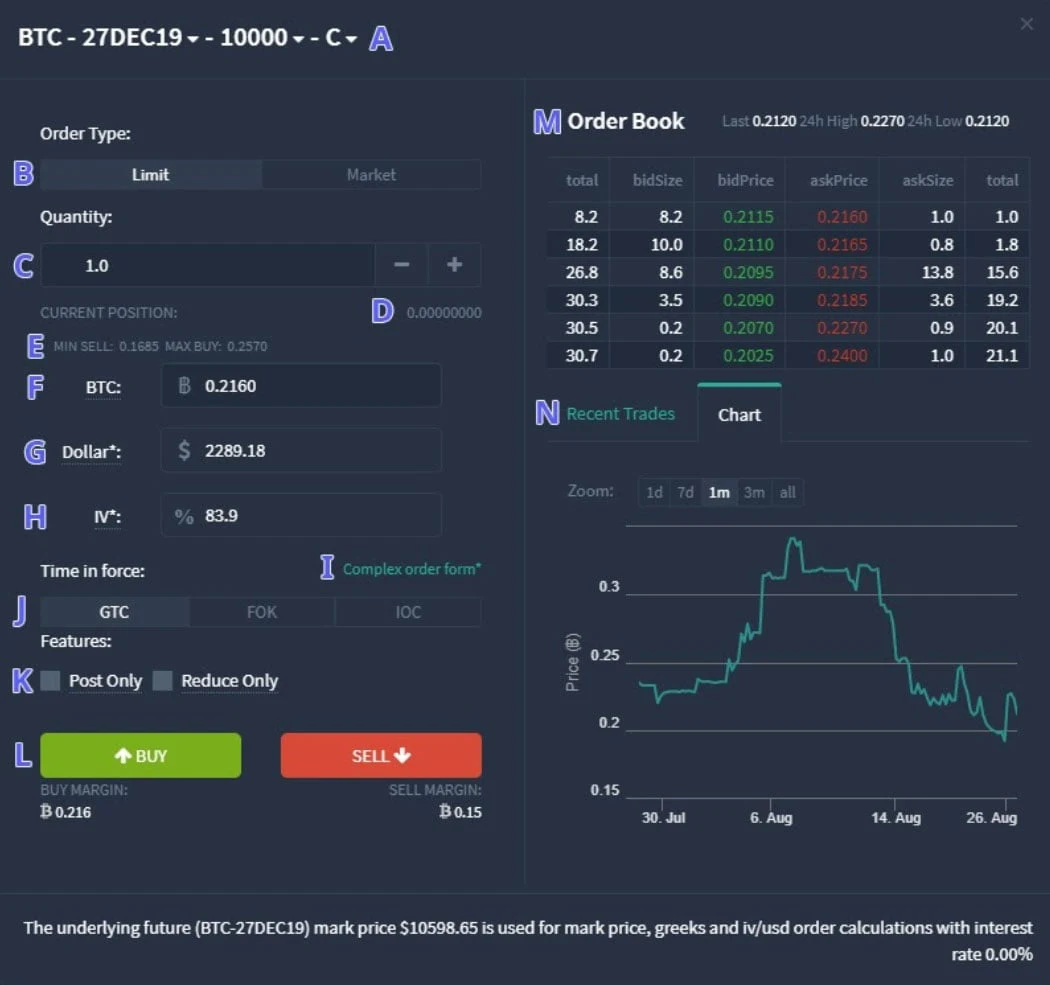
Bitcoin options market for November 2026 (as of late October) shows:
Max pain: Approximately $86,000 — the price at which the maximum number of option contracts expire worthless. Prices tend to gravitate toward max pain heading into expiry, though the relationship is not deterministic.
Put/Call ratio: Approximately 0.62 — more call open interest than put open interest, indicating net bullish positioning in the options market. This reading is consistent with Q4 seasonality expectations.
Implied volatility (IV): 30-day IV at approximately 54%, elevated relative to the 38% average of the past 6 months. The IV elevation reflects uncertainty around potential breakout catalysts (CLARITY Act vote, ETF rebalancing, Devcon narrative) in November.
Exchange inflows and whale behavior
Coinbase Premium: The Coinbase-to-Binance BTC price premium has been consistently positive through October, suggesting institutional net buying from US-based players. A positive Coinbase premium is historically associated with institutional accumulation phases.
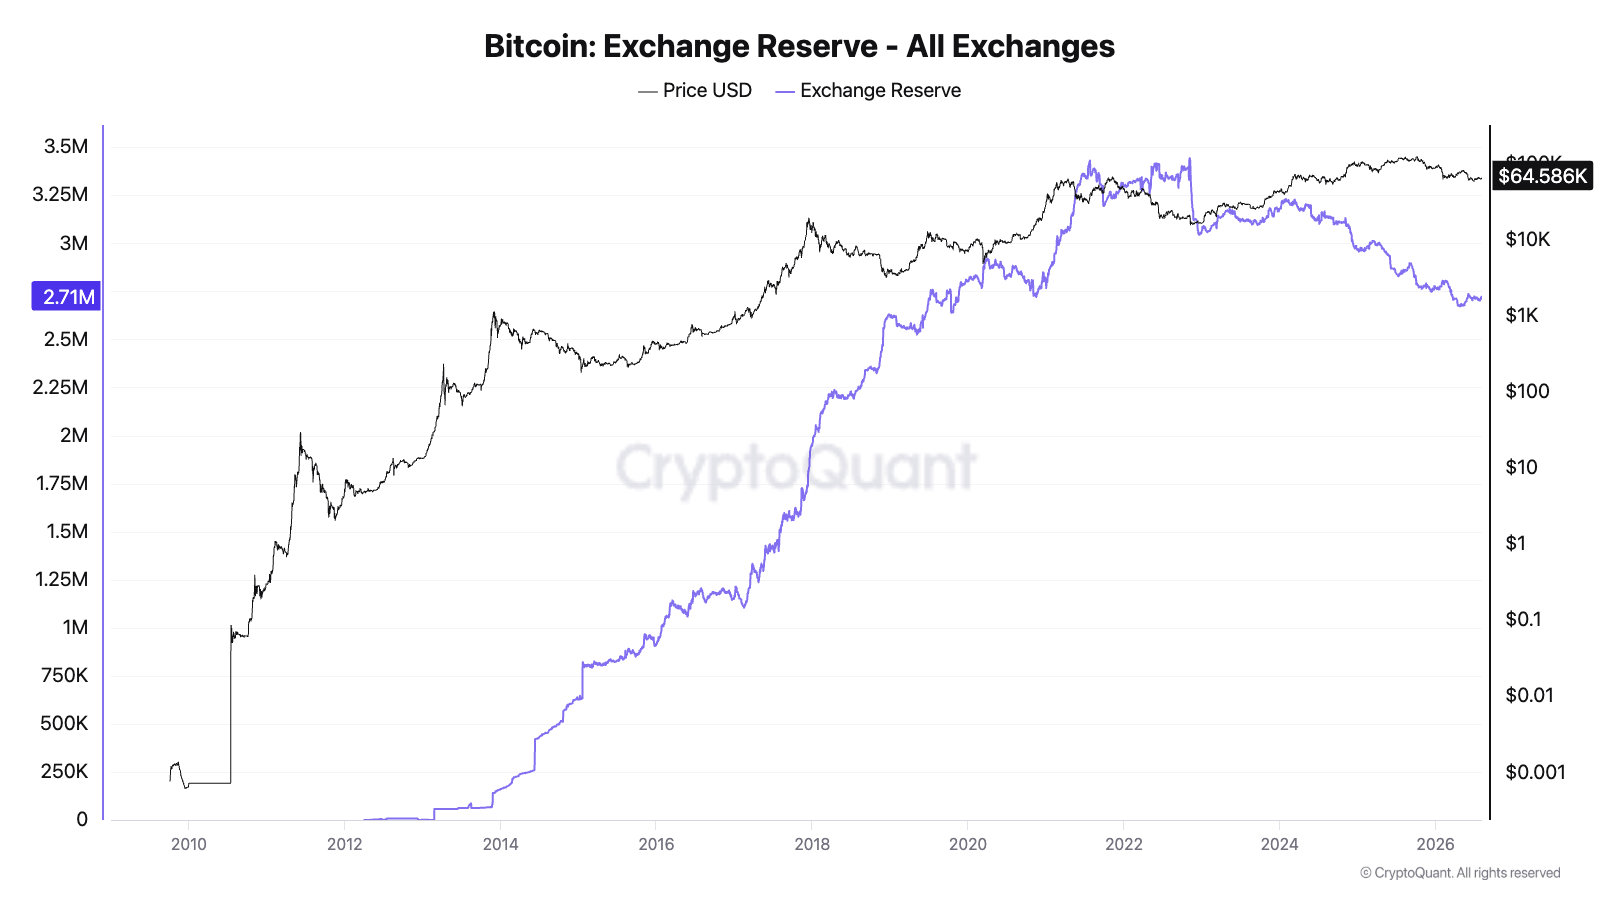
Exchange net flows (30-day): Net outflows from exchanges of approximately 14,200 BTC over the past 30 days. Persistent exchange outflows indicate coins moving to cold storage — a supply-reduction signal consistent with holder conviction rather than distribution intent.
Whale wallets (1,000+ BTC): On-chain data shows a net increase of 23 wallets in the 1,000+ BTC cohort over the past 30 days. New whale wallet creation is a leading indicator of institutional accumulation.
Macro catalysts in November that could move BTC
CLARITY Act Senate vote: The digital asset market structure bill (pending Senate floor scheduling) is the highest-potential positive catalyst for BTC in November. A successful vote would represent definitive US regulatory clarity and is likely to trigger institutional allocation decisions that have been held pending the outcome.
US CPI data (November 12): The October 2026 CPI print. Any upside inflation surprise reduces the probability of Federal Reserve rate cuts, which historically creates short-term pressure on risk assets including BTC.
Devcon 8 (November 3–6): Ethereum-focused event but historically generates broad crypto market narrative momentum. Limited direct BTC impact, but general sentiment spillover is real.
Bitcoin ETF quarterly rebalancing: Q4 ETF rebalancing by multi-asset funds that include Bitcoin can create systematic buying or selling pressure in the first two weeks of the quarter. October 2026 net flows into US spot Bitcoin ETFs have been positive — suggesting the rebalancing pressure is constructive going into November.
How to confirm a Bitcoin move instead of reacting to one metric
No single indicator is reliable enough to define the November trend. Price can rise while spot demand weakens, exchange outflows can reflect internal custody reshuffling, and options positioning can change rapidly around a large expiry. A stronger read comes from looking for agreement across spot price, derivatives, on-chain behavior, and macro liquidity.
Start with spot structure. A daily close above resistance matters more when volume expands and the level holds on a retest. Next, check whether perpetual funding and futures basis remain orderly. A rally driven by extreme positive funding and rising open interest is more vulnerable to a long liquidation than a rally supported by spot buying. Options add another layer: changes in implied volatility and put-versus-call demand show how traders are paying to hedge future outcomes rather than merely reacting to the current price.
On-chain metrics should be used as confirmation, not timing tools. Glassnode research separates holder cost basis, realized profit and loss, and spending behavior, while exchange-flow datasets attempt to identify coins moving into and out of labeled venues. Compare the direction over several days or weeks rather than treating one large transfer as a trend. A durable bullish setup usually combines price acceptance above resistance, neutral leverage, positive spot demand, and restrained profit-taking by older holders.
November scenario matrix
| Scenario | Confirmation to watch | What would weaken it |
|---|---|---|
| Bullish breakout | Daily closes above $94,200, stronger spot volume, stable funding, continued exchange outflows | Fast rejection below $92,000 or sharply rising leverage without spot follow-through |
| Range continuation | Repeated defense of $82,000–$84,000 and failure to hold above $92,000 | A high-volume close outside the range followed by a successful retest |
| Bearish breakdown | Daily close below $78,500, rising exchange inflows, negative Coinbase premium | Quick recovery above $82,000 with declining sell volume |
| Volatility squeeze | Falling realized volatility and compressed price range while open interest builds | A catalyst-driven expansion accompanied by spot volume and liquidations |
These are conditional paths, not price predictions. The value of a scenario matrix is that it defines what evidence must appear before the interpretation changes. Traders can update the scenario after each daily or weekly close instead of changing direction in response to every intraday move.
Cost-basis and holder behavior indicators
Realized price and holder cost-basis bands help estimate where different groups of buyers may feel pressure. When market price remains above a major cohort’s cost basis, those holders are generally sitting on unrealized profit. A move below it can turn that area into resistance as buyers seek to exit near breakeven. Short-term holder metrics are especially useful during corrections because recent buyers are more likely to react to volatility than long-dormant wallets.
MVRV compares market value with realized value and is better suited to regime analysis than exact entry timing. Realized profit and loss show whether coins moving on-chain are crystallizing gains or capitulating. Spent-output age data adds context by showing whether activity comes from recently acquired coins or long-held supply. These indicators are most useful when they agree with price structure; a divergence should prompt caution rather than an automatic trade.
Risk management for a high-volatility month
Define invalidation before entering a position. For a breakout trade, invalidation may be a close back inside the former range; for a support trade, it may be a confirmed loss of the support zone. Position size should be based on the distance to that invalidation point, not on confidence in a price target.
Avoid treating high open interest as automatically bullish. It represents outstanding leverage on both sides and can amplify liquidation cascades. Around CPI releases, policy votes, and major options expiries, reduce leverage or wait for the first volatility reaction to settle. Investors using spot positions can apply the same logic by scaling entries across levels instead of committing the full allocation to one price.
Finally, keep data timestamps aligned. Spot price, options metrics, ETF flows, and on-chain dashboards may update on different schedules. A comparison made from mismatched periods can create a false signal. Record the observation time and revisit the thesis after the next confirmed daily close.
FAQ
What is Bitcoin’s price target for November 2026?
This analysis does not provide price targets. The $98,000–$100,000 range is the primary resistance zone where a sustained breakout would be technically significant. The $84,000–$85,000 zone is the first meaningful support below current levels.
Is Bitcoin a buy in November 2026?
This is market analysis, not investment advice. November has historically been Bitcoin’s strongest month by average returns. Current on-chain signals (exchange outflows, whale accumulation, positive Coinbase premium) are constructively positioned. Macro risk (CPI, Fed policy) is the primary headwind.
What is the Coinbase premium and why does it matter?
The Coinbase premium is the price difference between BTC on Coinbase (primarily US institutional buyers) versus Binance (global retail dominant). A consistent positive premium indicates US institutional buyers are paying above global market price — interpreted as a signal of institutional demand.
Disclaimer: This article is for informational purposes only and does not constitute financial or investment advice. Cryptocurrency and digital asset markets carry significant risk. Always do your own research before making decisions.
More From Bitcoin (BTC)

