


Buying pressure decreased, Solana faced the risk of losing the 225 USD mark
Solana (SOL)’s attempt to regain historic highs has encountered strong resistance. This confrontation has also created conditions for Solana bears to push the p...
[ad_1]
Solana (SOL)’s attempt to regain historic highs has encountered strong resistance. This confrontation has also created conditions for Solana bears to push the price down as it continues to hover around $238.
For now, SOL investors can hope for a quick recovery, but the latest forecast suggests that may not happen anytime soon.
High Low Low Liquidity for Solana
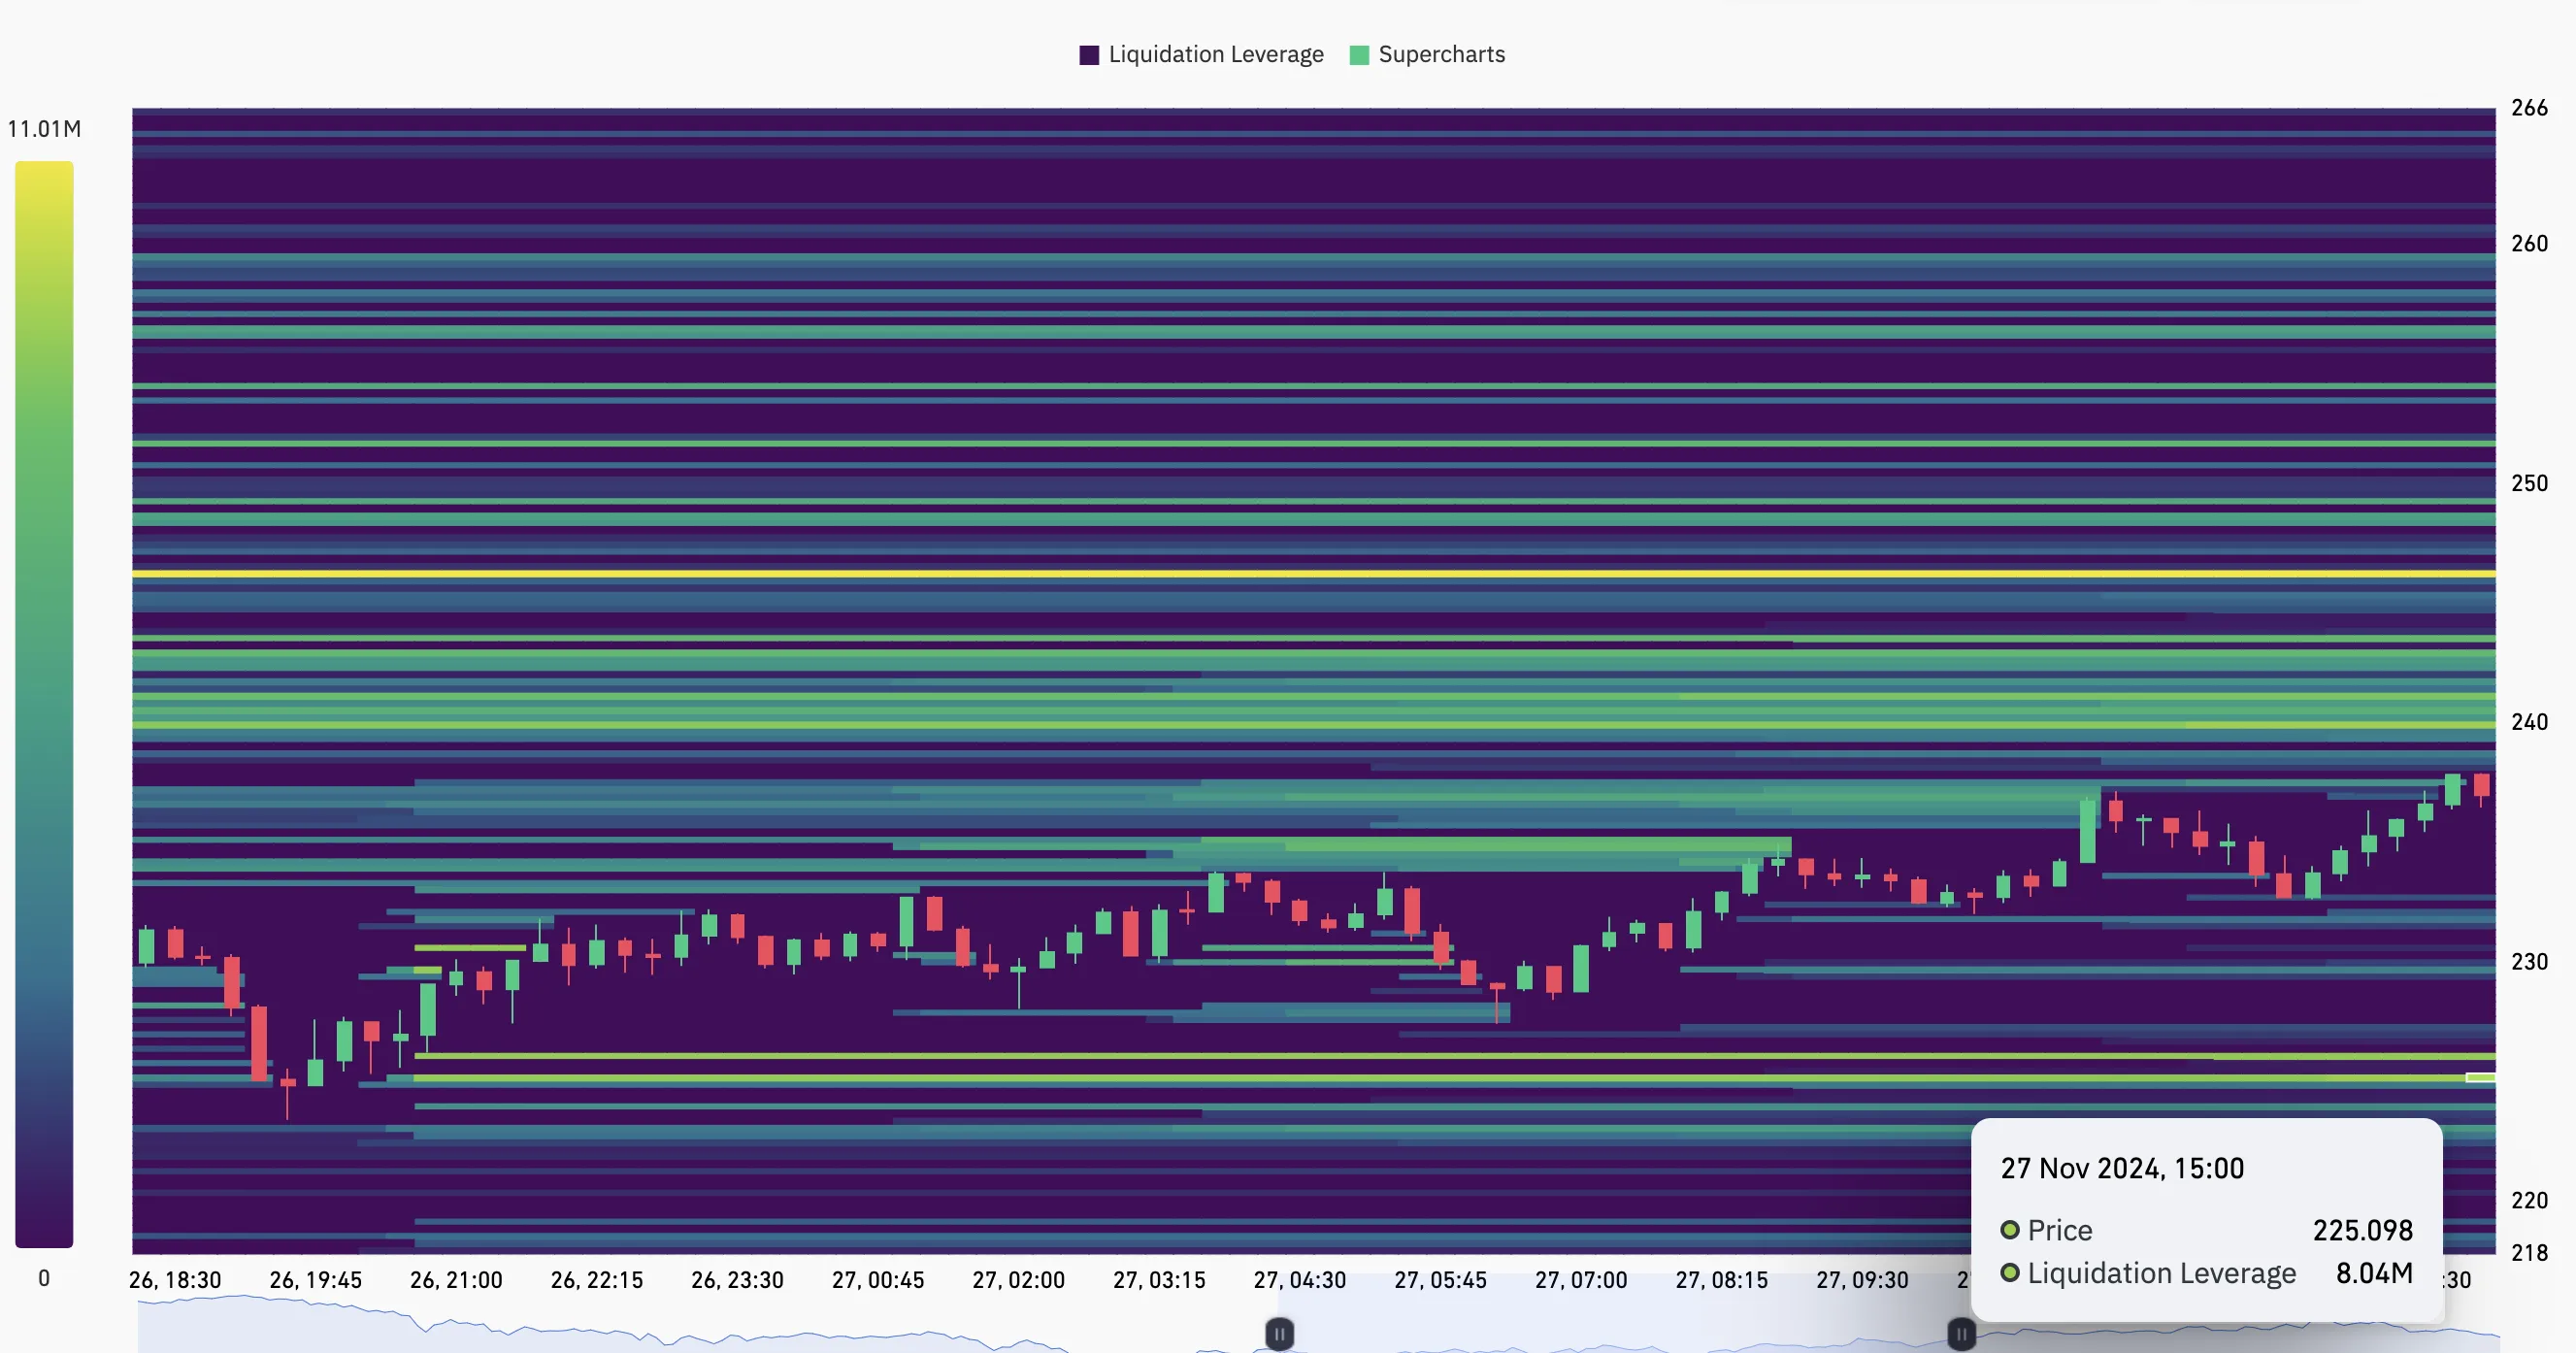
The liquidity heat map is an indicator that shows that the SOL price may be adjusted downward. The heat map predicts the major price levels at which liquidations are likely to occur and aids in understanding high liquidity areas on the order book.
For example, if there is a large concentration of liquidity in a certain area, the color on the heat map will change from purple to yellow. In most cases, this suggests that the price of the Cryptocurrency may move towards that area. On the contrary, if the concentration is low, the color will remain purple.
Looking at the three-day timeframe, the liquidity heatmap indicates that there is a high concentration of liquidity at $246. However, another focus also emerged at $225, which appears to be a support level. Given the low trading volume, it is likely that Solana bears will push the price of this altcoin to or below this level.
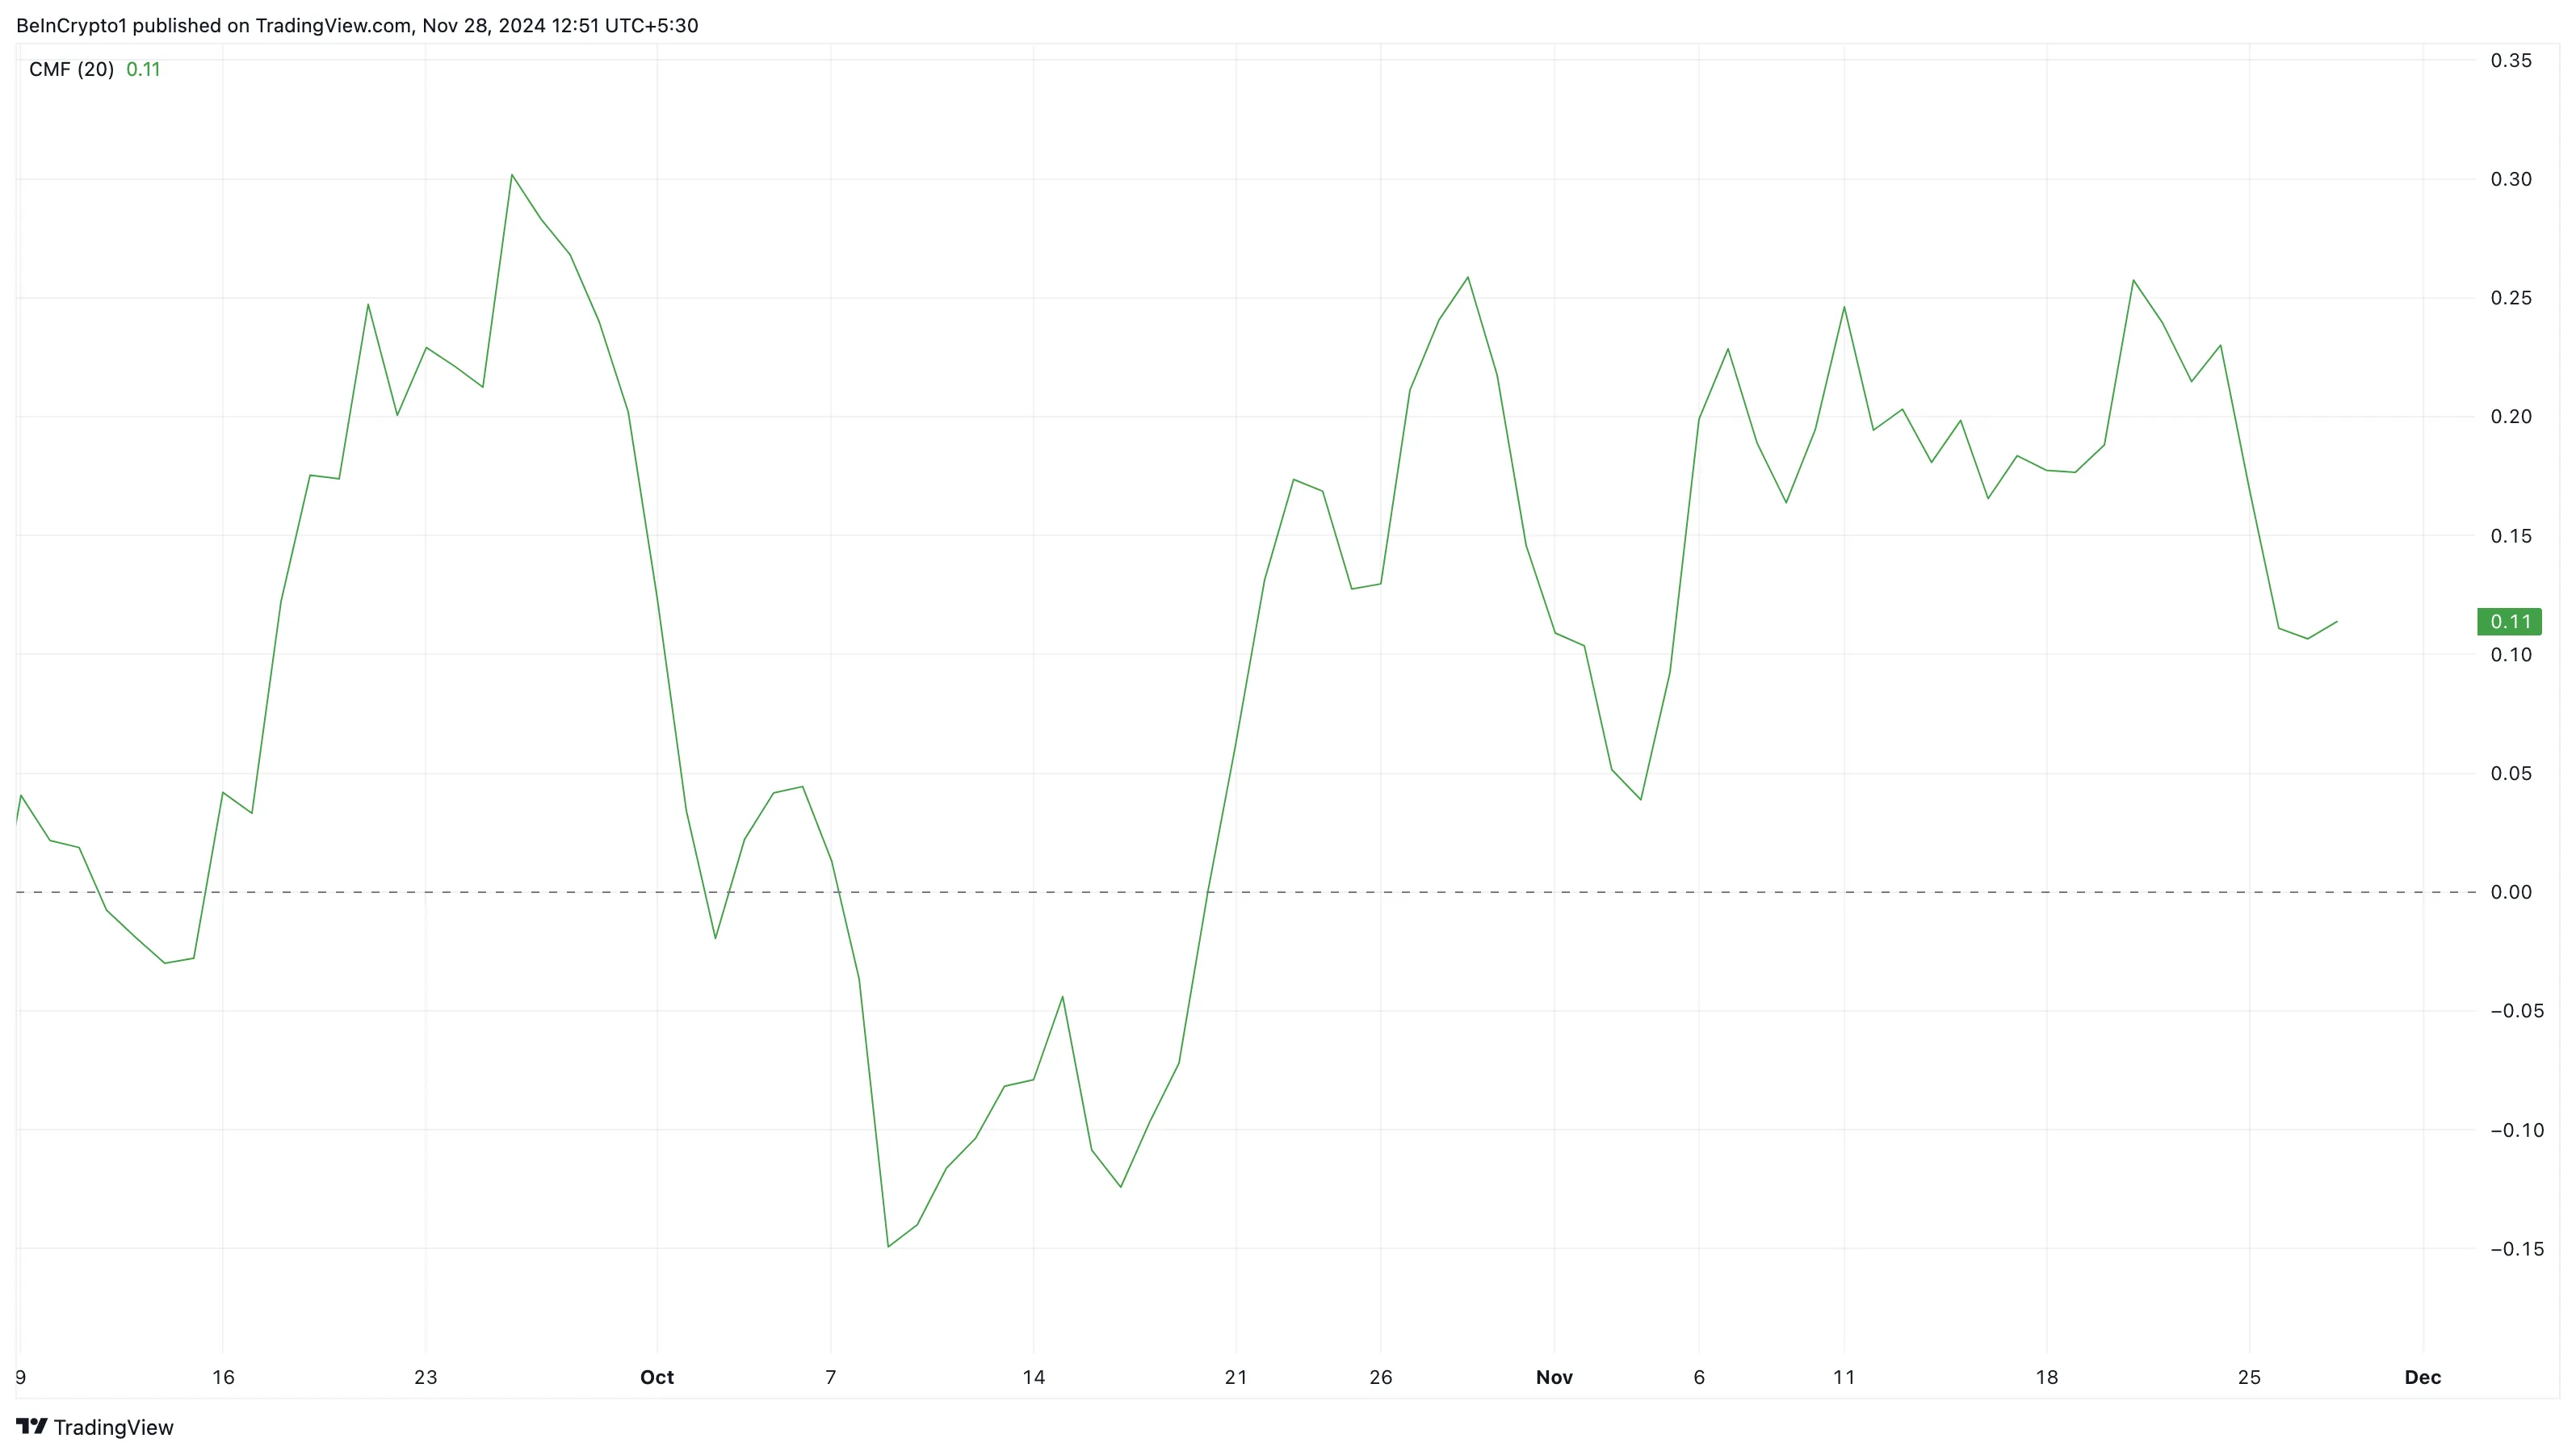
Additionally, the SOL/USD daily chart shows a decline in the Chaikin Money Flow (CMF) index, which tracks the flow of liquidity into and out of a Cryptocurrency.
Improving CMF index points to increased buying pressure, suggesting the possibility of price increases. Conversely, a declining CMF reflects increasing selling pressure and capital outflows, which typically suggest falling prices.
In the case of Solana, the fall in CMF is consistent with increased selling pressure, reinforcing the case for further price declines, as highlighted earlier.
SOL Price Forecast: 300 USD Is Not Near Anymore
Another review of the daily chart shows that the Balance of Powers (BoP) Indicator has fallen into the negative zone. BoP is a price-based indicator that compares the strength of bulls and bears.
When this index increases and is positive, it means that the bulls are dominant. But in this case, it appears that the Solana bears are in control. If this trend continues, the price of SOL could drop below $225.
If sustained, the Fibonacci retracement indicator suggests that the altcoin could drop to 23.6% around $222. In extreme negative cases, it can drop up to 200 USD.
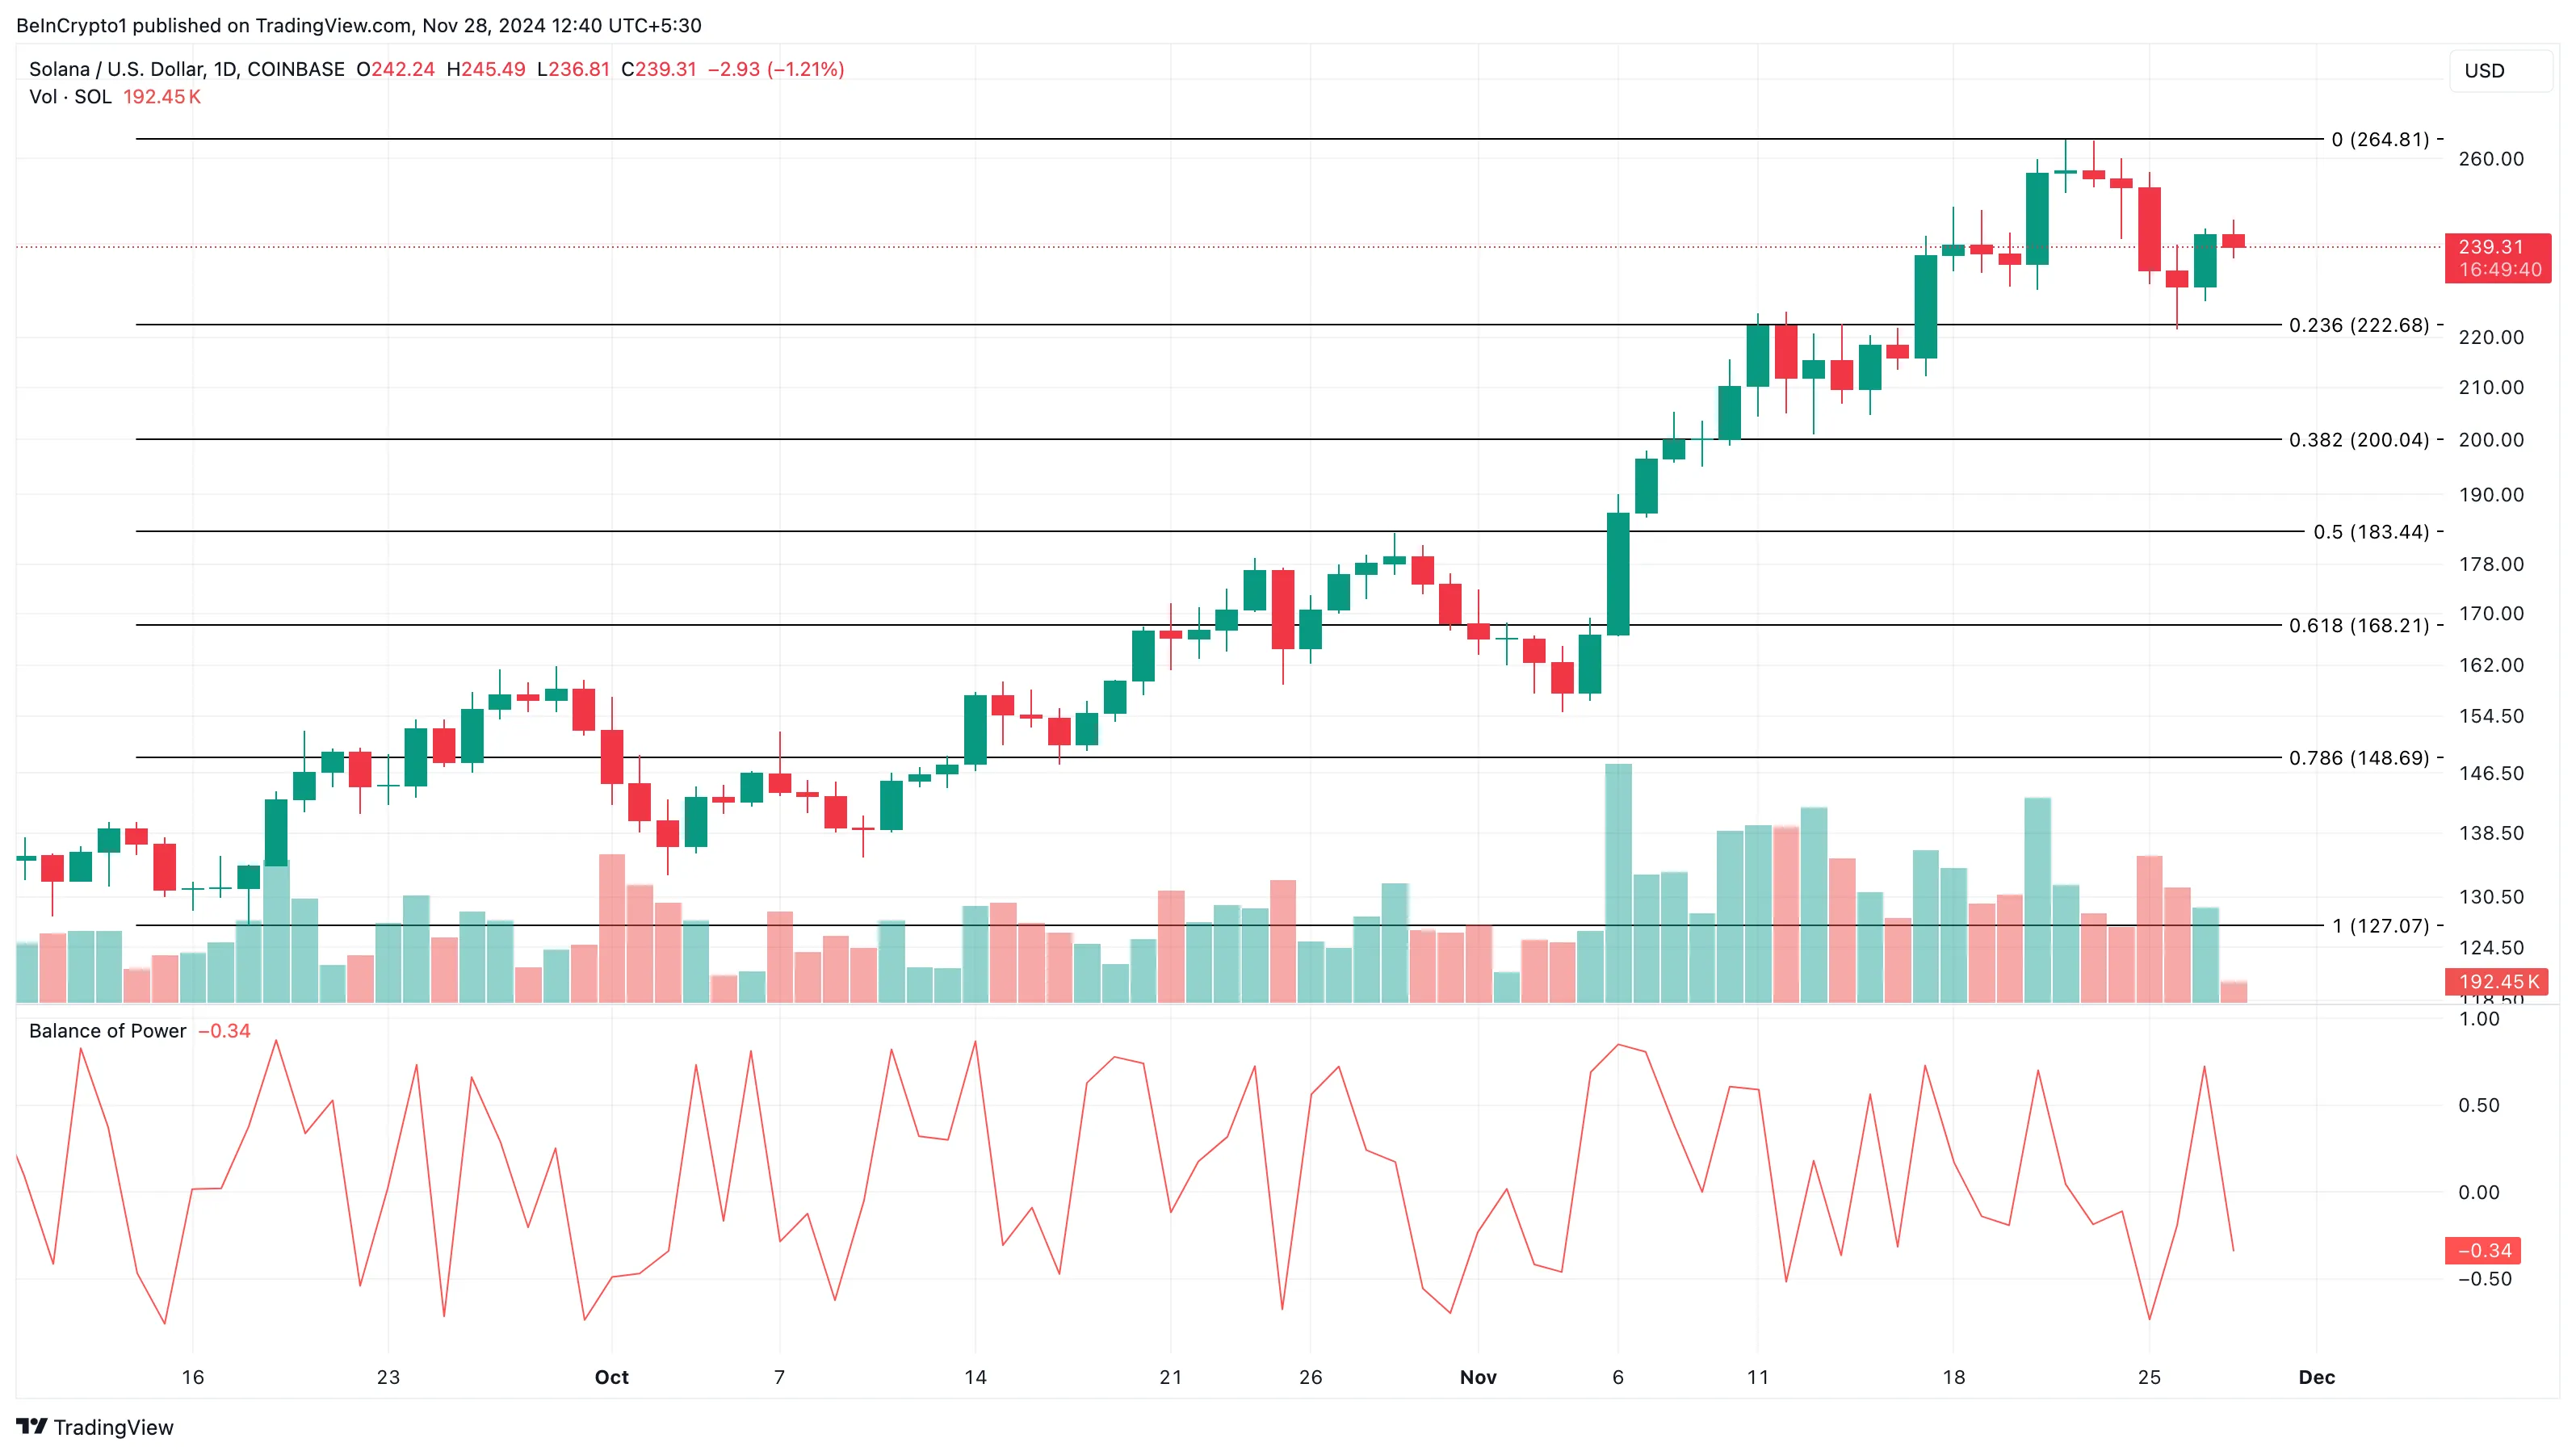
However, if buying pressure increases, that may not happen. In that scenario, the altcoin value could increase to $265.
General Bitcoin News
[ad_2]
More From Market

Strait of Hormuz Shipping Attack Raises Oil Supply Fears
An attack on Strait of Hormuz shipping has renewed fears for oil supplies, according to unconfirmed reports, though the specific incident behind the headline re...

Block EPS Jumps 65%, Stock Falls Despite Strong Earnings
Block reported a 65% surge in earnings per share, yet its stock fell in the wake of the results, a disconnect that made market sentiment, rather than the headli...

BTC Price Warning: 4 Reasons Bitcoin Could Drop Next Week
This BTC price warning centers on a single decision level: Bitcoin has struggled to maintain the $65,000 mark, and a four-part downside setup has traders watchi...

Crypto Price Analysis July 24: ETH, XRP, ADA, BNB, HYPE
Ethereum is the only asset in this group with a defined weekly move, up 3% but pressing into resistance, according to CryptoPotato’s July 24 price analysis . Th...

FT report: London Stock Exchange plans round-the-clock trading
The London Stock Exchange is looking at moving to round-the-clock trading, the Financial Times reported . In practice, that would mean shares could be bought an...

Bitcoin Price Analysis: BTC Bearish Below Key Reclaim
Bitcoin’s market structure remains bearish, with BTC unable to reclaim a key resistance level that would shift momentum back in favor of bulls. Until that level...

Author
Kishu Inu
Kishu Inu reports on crypto market activity, Web3 project updates, and blockchain business developments for CoinLive.