Ethena (ENA) price has experienced significant volatility, up 63% in the past 30 days but down 11% in the past week. Despite the recent correction, ENA still maintains a strong market presence with a current capitalization of $3 billion.
Technical indicators, including RSI and DMI, suggest that the token is in a consolidation phase, lacking strong directional momentum. Traders are closely watching key support and resistance levels to gauge ENA’s next move in the short term.
ENA’s RSI Is Currently In Neutral Status
ENA’s Relative Strength Index (RSI) is currently at 47.3, reflecting a neutral status from December 21. RSI values in this range suggest there is no clear control among buyers and marketplace sellers, with Tokens representing balanced trading dynamics.
This neutral position indicates that recent price movements lack significant directional strength, with no clear evidence of overbought or oversold conditions.

RSI, a widely used momentum indicator, measures the speed and variability of price movements on a scale of 0 to 100. Typically, an RSI above 70 signals that an asset may be overbought. too much and could face a potential price correction, while an RSI below 30 indicates oversold conditions, suggesting the possibility of a recovery.
With Ethena’s RSI at 47.3, the token is still in a consolidation phase, neither signaling a strong bullish momentum nor warning of upcoming bearish activity. In the short term, this level could imply that Ethena price could continue to trade sideways, although any break above or below the key RSI threshold could prompt a shift in momentum.
ENA’s DMI Shows Unclear Trend
ENA’s Directional Movement Index (DMI) chart shows that its Average Directional Index (ADX) is now at 10.7, down from 20 on December 21. The decline in ADX indicates a trend weaker, as values below 20 typically indicate a lack of significant directional strength in the market.
This decline reinforces the view that ENA is not experiencing a strong, sustained upward or downward trend, indicating a period of market indecision or consolidation.

ADX, a key component of the DMI, measures the strength of a trend without indicating its direction. Values above 25 indicate a strong trend, and values below 20 signal a weak or no trend. The DMI also combines two directional indexes: a positive directional index (D+, currently at 22) and a negative directional index (D-, currently at 17.97).
In the case of ENA, D+ is higher than D- indicating slight bullish dominance, but the low ADX value at 10.7 shows that the trend lacks meaningful strength. This combination suggests that ENA’s short-term price movements are likely to remain muted, with no clear directional momentum, which could lead to range trading. A rise in ADX could signal a shift towards stronger trends in both directions.
ENA Price Prediction: Could ENA Drop Below $0.80 Soon?
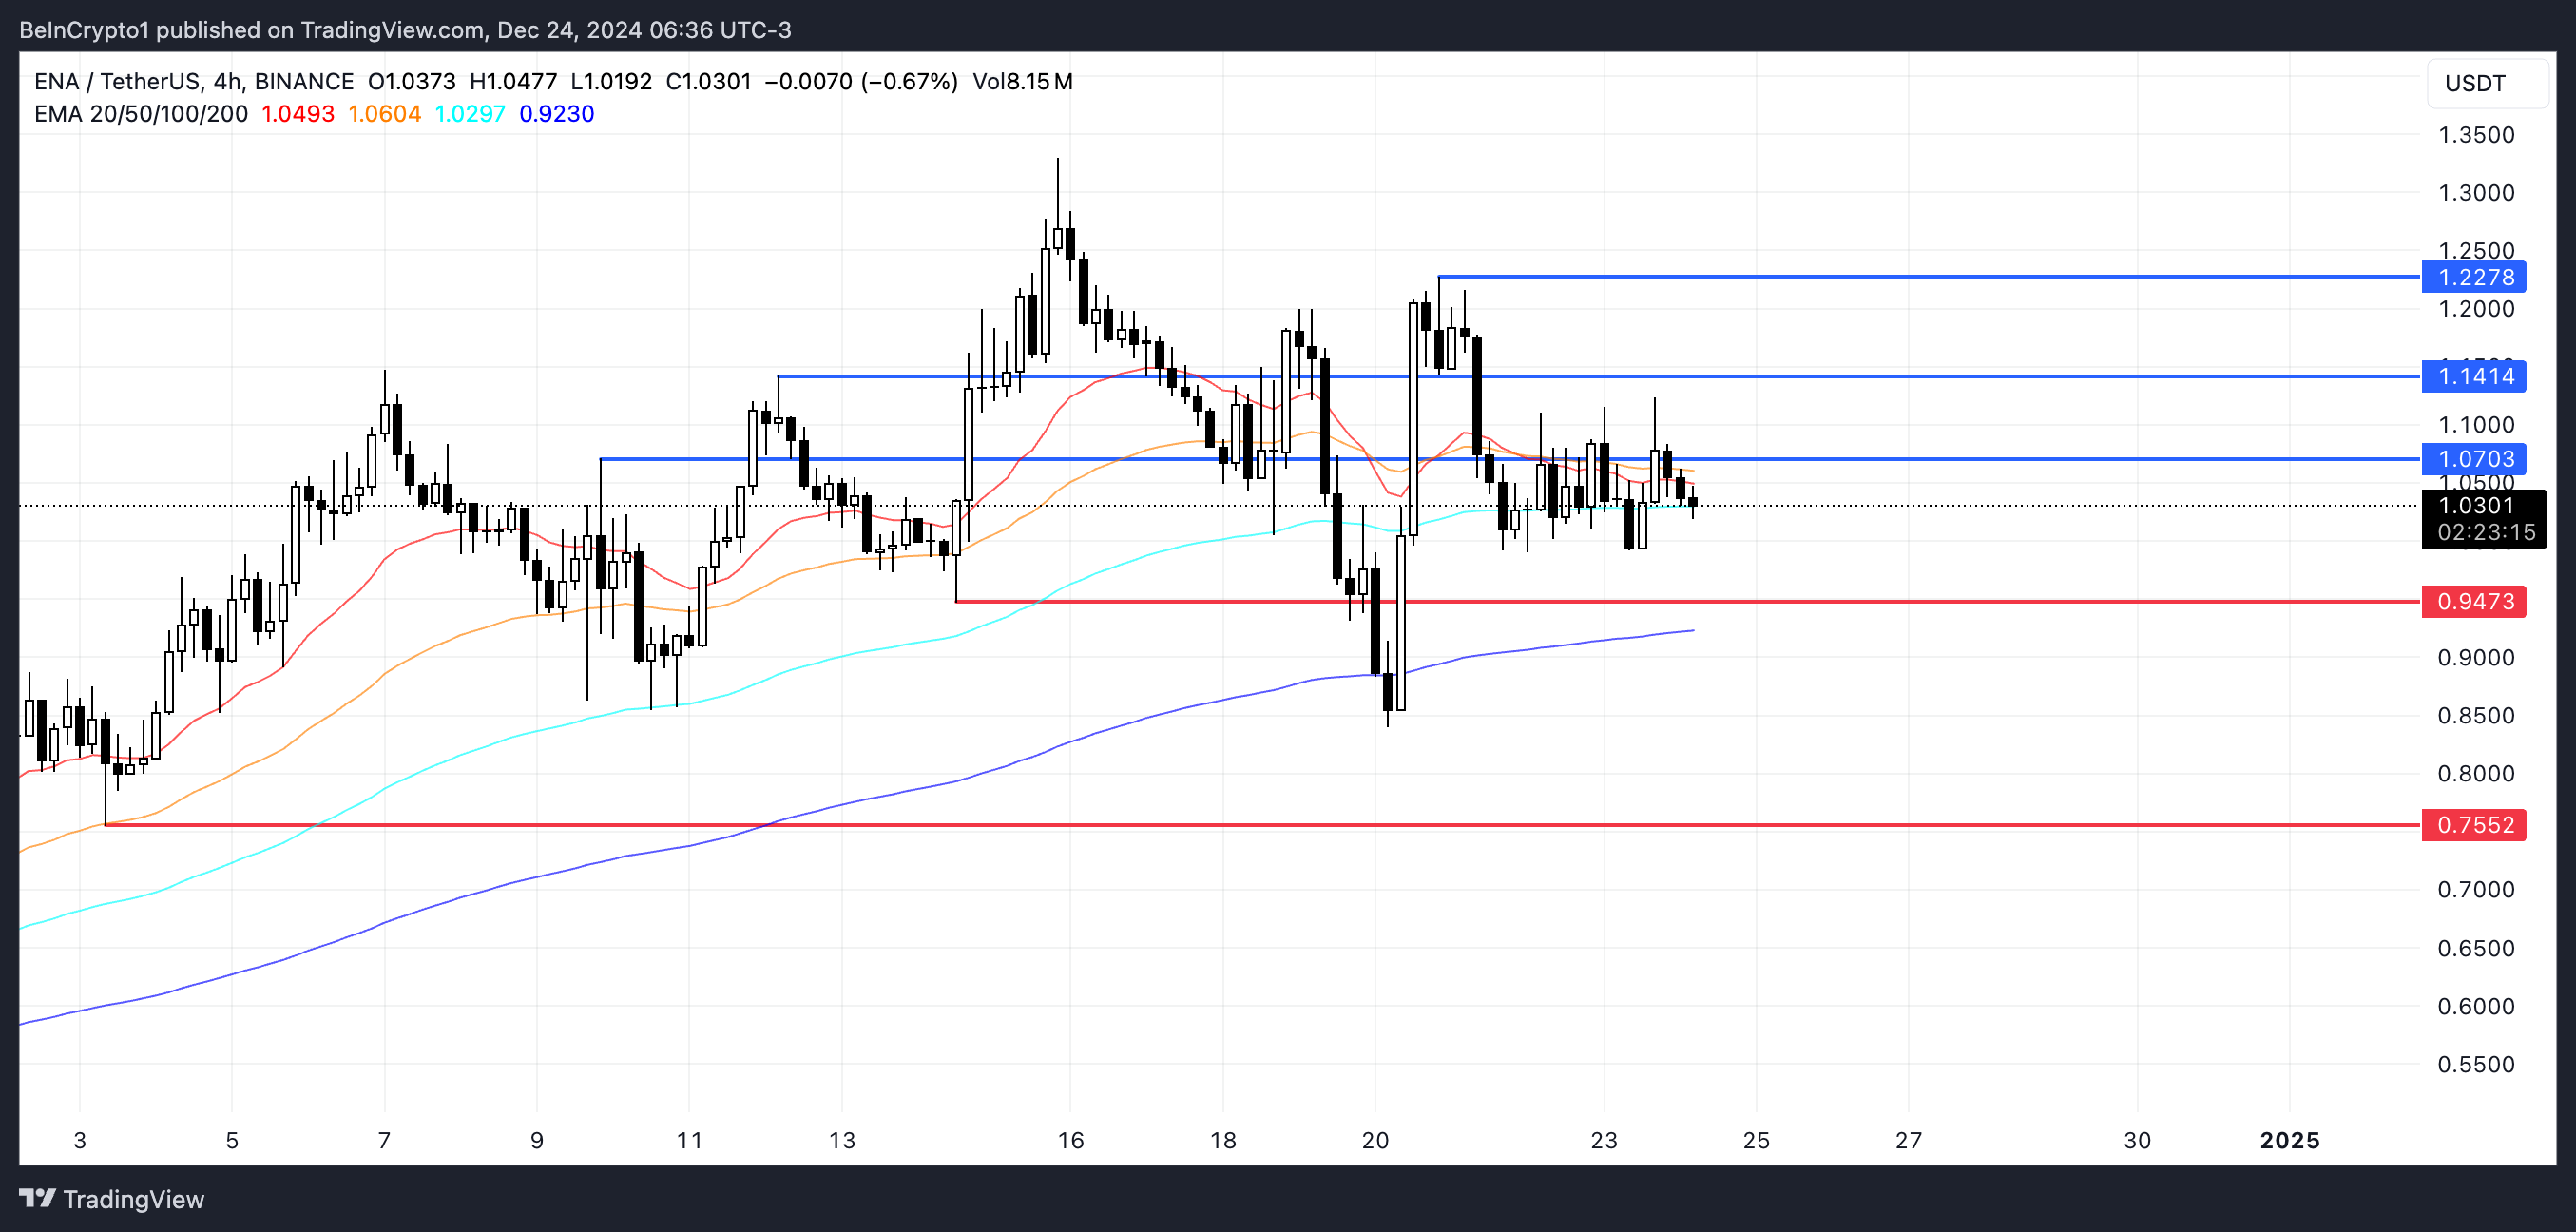
Ethena is currently trading within a range, with resistance at $1.07 and support at $0.94 defining its immediate price limits. A break above the $1.07 resistance could pave the way for ENA price to test the next resistance at $1.14, with further upside momentum possibly pushing the price to $1.22.
This scenario represents a potential 18% upside from current levels, suggesting a favorable risk-reward ratio for bullish traders if momentum picks up.

Conversely, if the $0.94 support fails to hold, ENA price could face a sharp decline, with the price possibly falling to $0.75 — a 27% downside risk. This shows the importance of the current range, as a break of either level will likely determine ENA’s short-term price trend.
While a break above $1.07 signals a continuation of the uptrend, a break below $0.94 could attract selling pressure, making these levels important for traders. Monitor translation carefully.
