Hedera price (Hbar) has increased by 11% in the past 24 hours, with market capitalization of 13 billion USD and trading volume increased by 78% to 745 million USD. The technical indicators show that Hbar may be entering the uptrend stage, when the ADX increases to 13.97, signaling the motivation to improve.
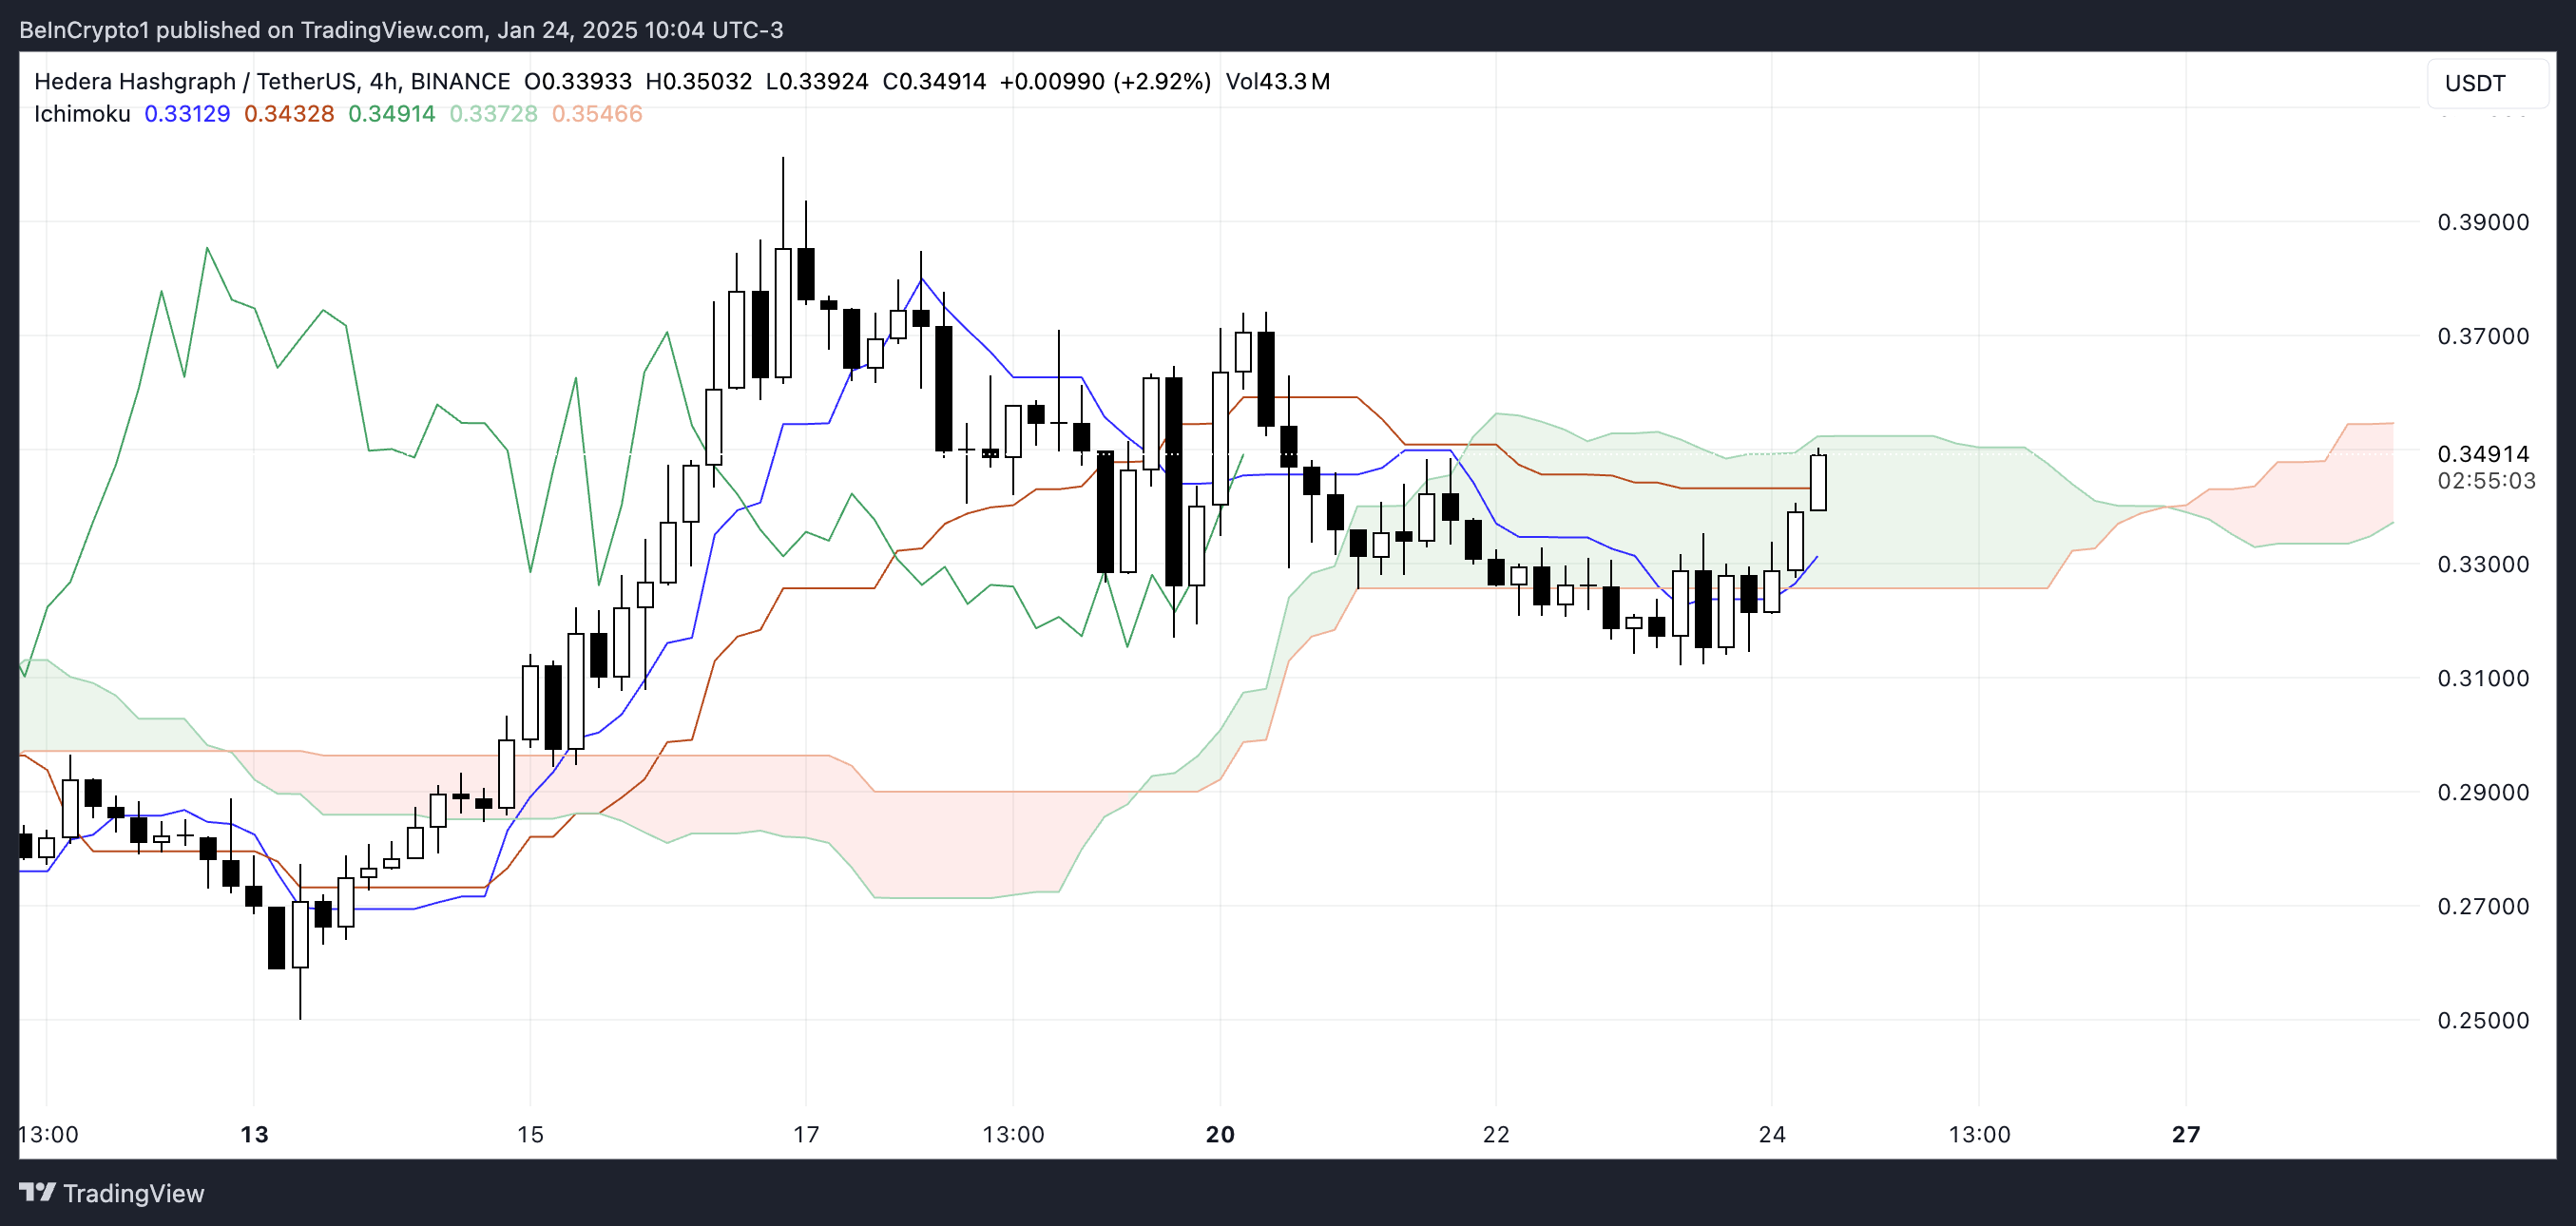
This Ichimoku Cloud chart supports this positive prospect, with a breakthrough on the cloud and the Tenkan-sen and Kijun-sen lines are tending to increase. If Hbar surpasses the resistance at $ 0.374, it may increase to 0.40 USD sharply, although the reversal can test important support levels at 0.31 USD and 0.296 USD.
Hbar ADX pointed out the current trend lacking strength
Hedera’s ADX (Average Directional Index) currently stands at 13.97, increasing from 12.7 yesterday, signaling the potential transformation from the downtrend to the trend of emerging.
ADX is a technical indicator to measure the power of a trend, regardless of direction. The value below 20 shows a weak or non -existent trend, while the value above 25 shows a strong trend. The increased values confirm the growing power of the trend.

At 13.97, Hbar’s ADX is still below 20, showing the new increase trend in the early stages and lacking significant strength.
However, the increase from yesterday shows that the dynamic is starting to form. If the ADX continues to increase, it can confirm a stronger trend of increasing, pushing Hbar price increase again.
Hedera’s ichimoku Cloud chart shows the price increase
The iChimoku Cloud chart for Hbar shows a breakthrough on the cloud, saying the price has moved into the area more smoothly.
The blue cloud in front (Senkou Span A on Senkou Span B) suggests potential support in the case of adjustment, while the Tenkan-sen line (blue line) and Kijun-sen (red line) tends to tend to Increase, signal short -term dynamics in accordance with the psychology of increasing price wider.

With Hbar price over the cloud and both leading indicators showed the price increase, Hedera seemed to continue his increase trend.
However, if the price reverses and reduces into the cloud, it can show the unity or dynamic weakness. The blue cloud below can act as a support, keeping the wider price increase structure.
Predicting Hbar price: increasing potential 14%
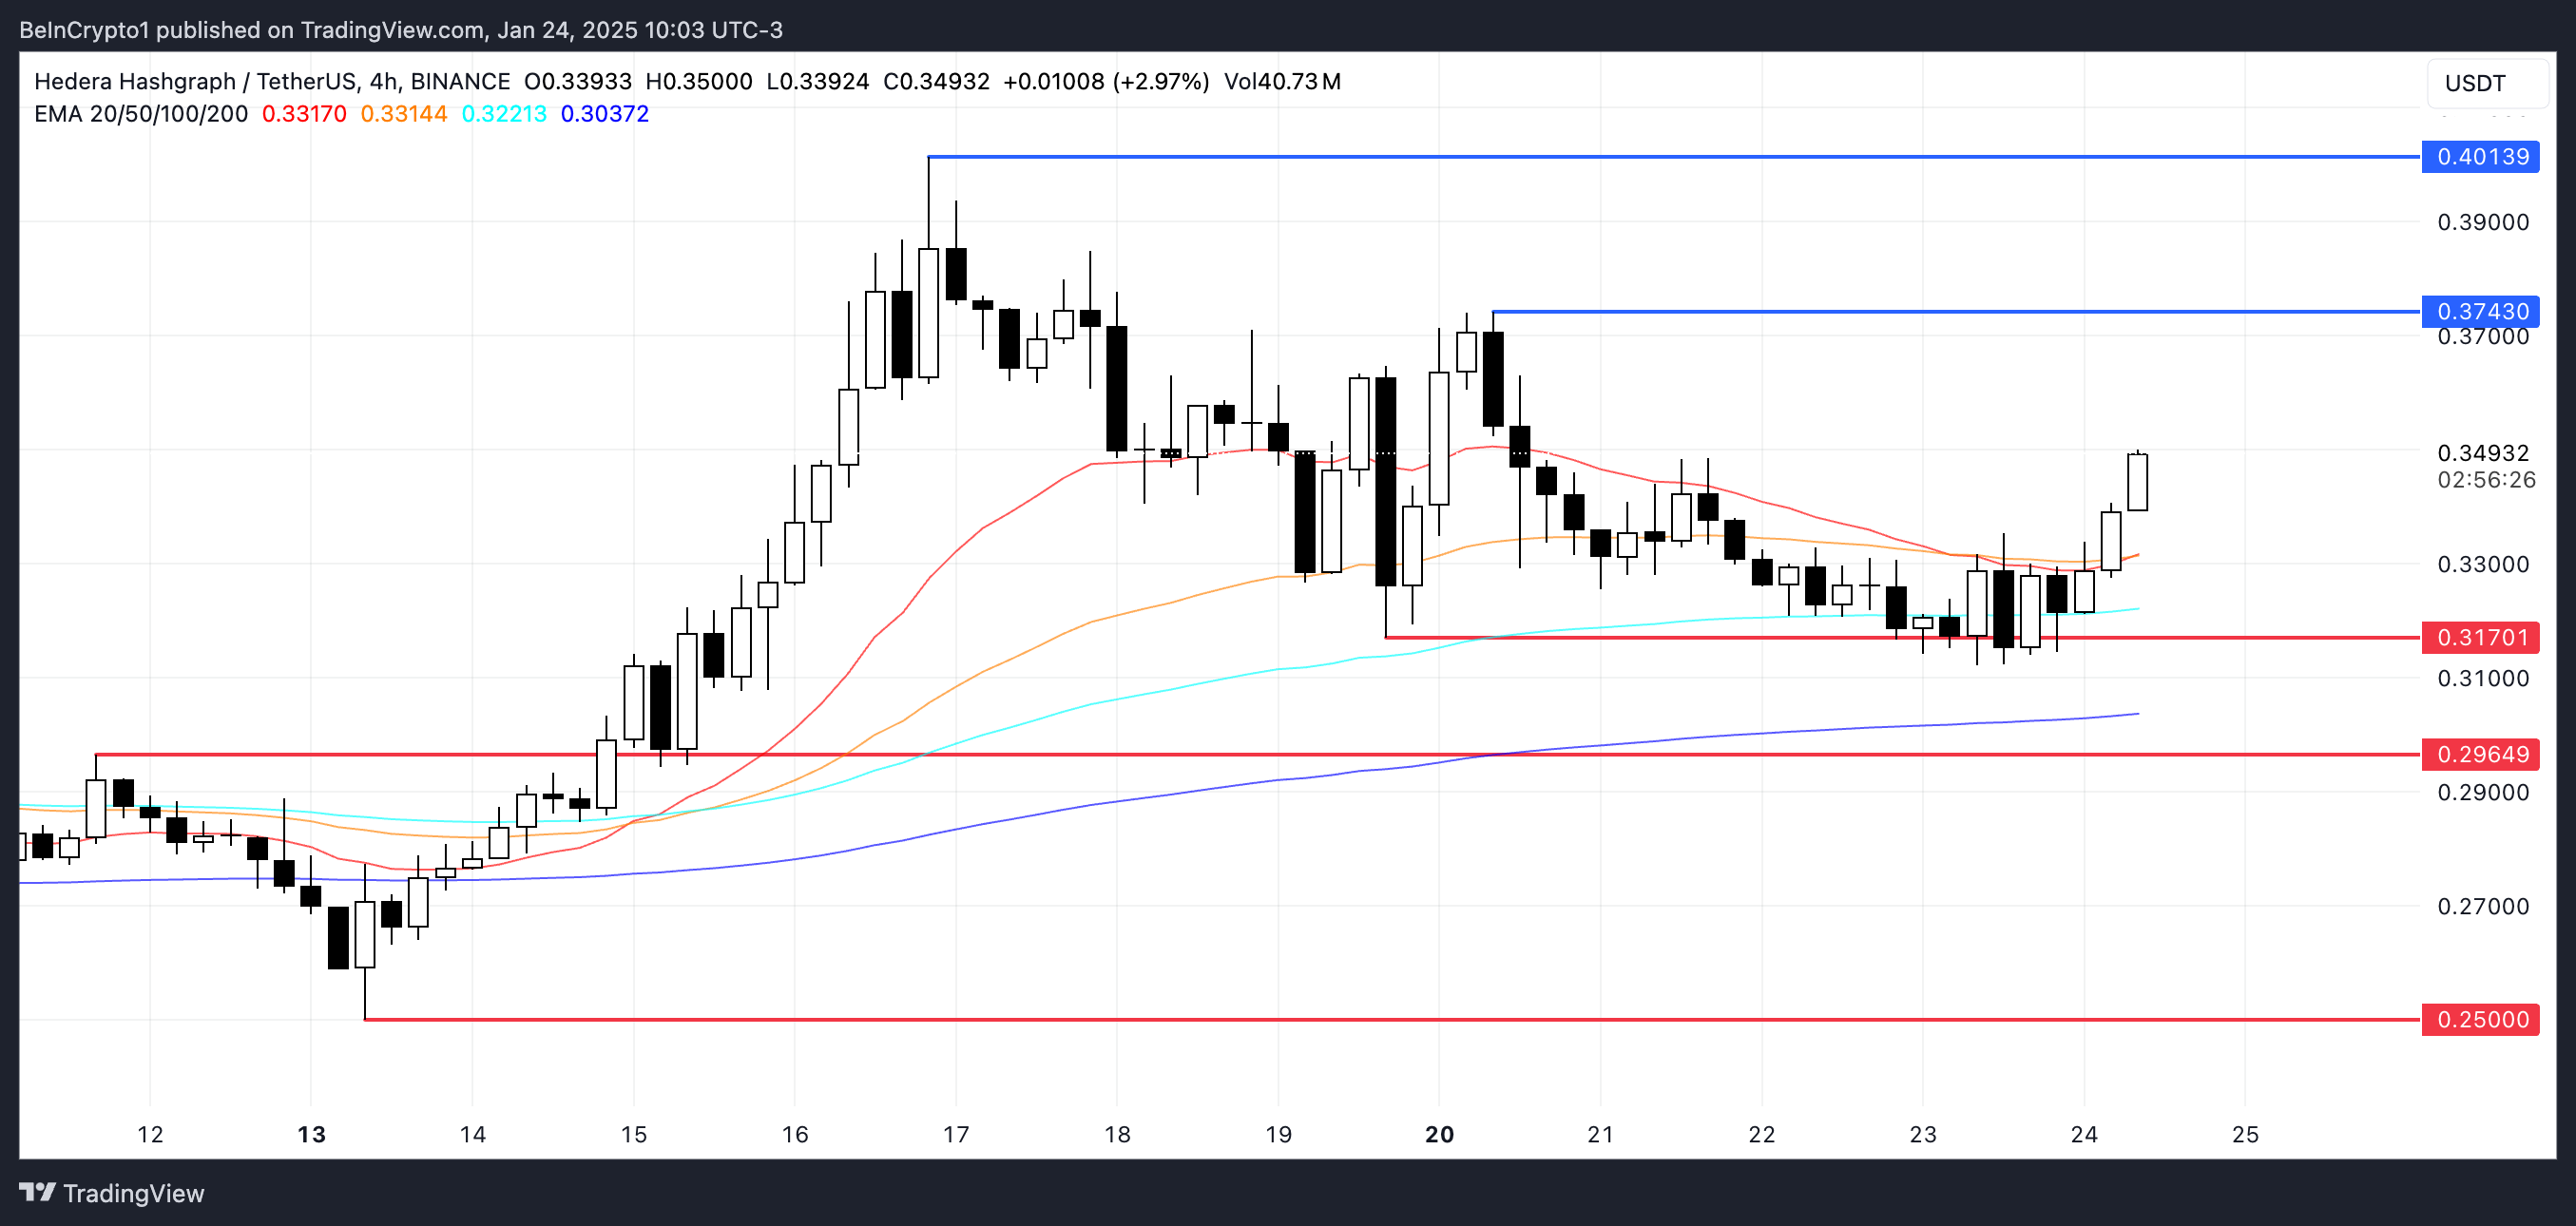
Hbar’s next important resistance is nearly $ 0.374, with EMA lines showing that a gold intersection may be formed soon. If this price intersection is confirmed, it may activate a sharp increase, can exceed the resistance of $ 0.374 and push Hedera price to $ 0.40.
This move will represent an increase of 14.2%, signaling new power in the current increase trend.

Conversely, if the current trend is reversed, immediately supported at 0.31 USD could take place. A breaking below this level can lead to subsequent decline, with the next support at $ 0.296 and the ability to reduce up to $ 0.25 if it cannot play a support role.
