Several on-chain indicators for Ethereum (ETH) are pointing to the possibility of a short-term price correction after the cryptocurrency surged 35% in the past 30 days. ETH recently touched $4,000, creating concerns that it may have been overbought.
As the price reaches this key resistance level, indicators suggest selling pressure could intensify, potentially leading to a correction before any further upside move.
Ethereum Signals Price Drop
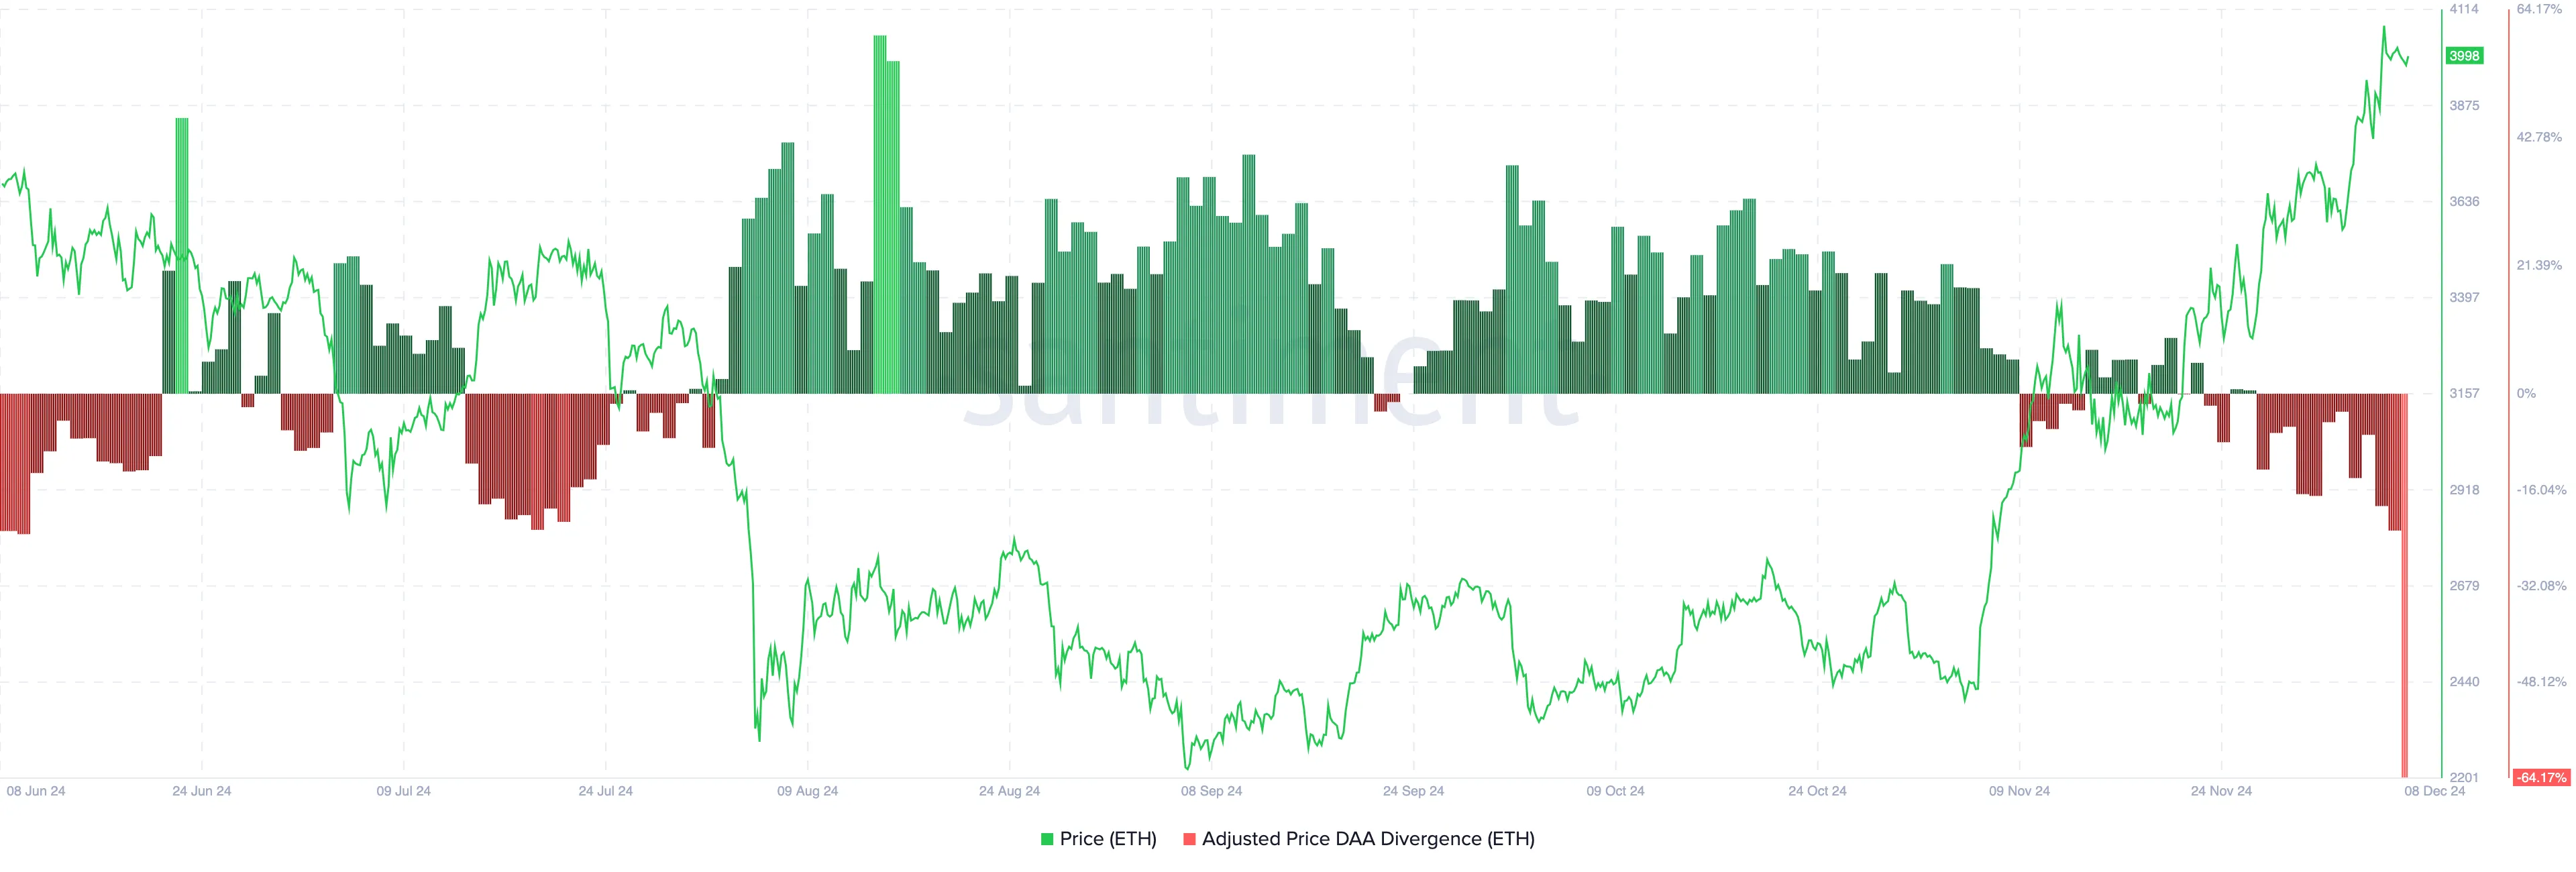
One of Ethereum’s leading on-chain indicators hinting at this decline is the divergence between price and daily active addresses (DAA). Simply put, DAA price divergence shows whether the value of a cryptocurrency is increasing with user participation.
When the index is positive, it implies that user participation has increased, creating room for prices to continue to escalate. Conversely, when the DAA price is negative, it shows that network activity has decreased, so the upward momentum may stall.
According to Santiment, Ethereum’s DAA price divergence has dropped to -64.17%. This sharp drop indicates a decline in addresses interacting with the cryptocurrency. With the conditions mentioned above, the price of ETH may decrease accordingly.

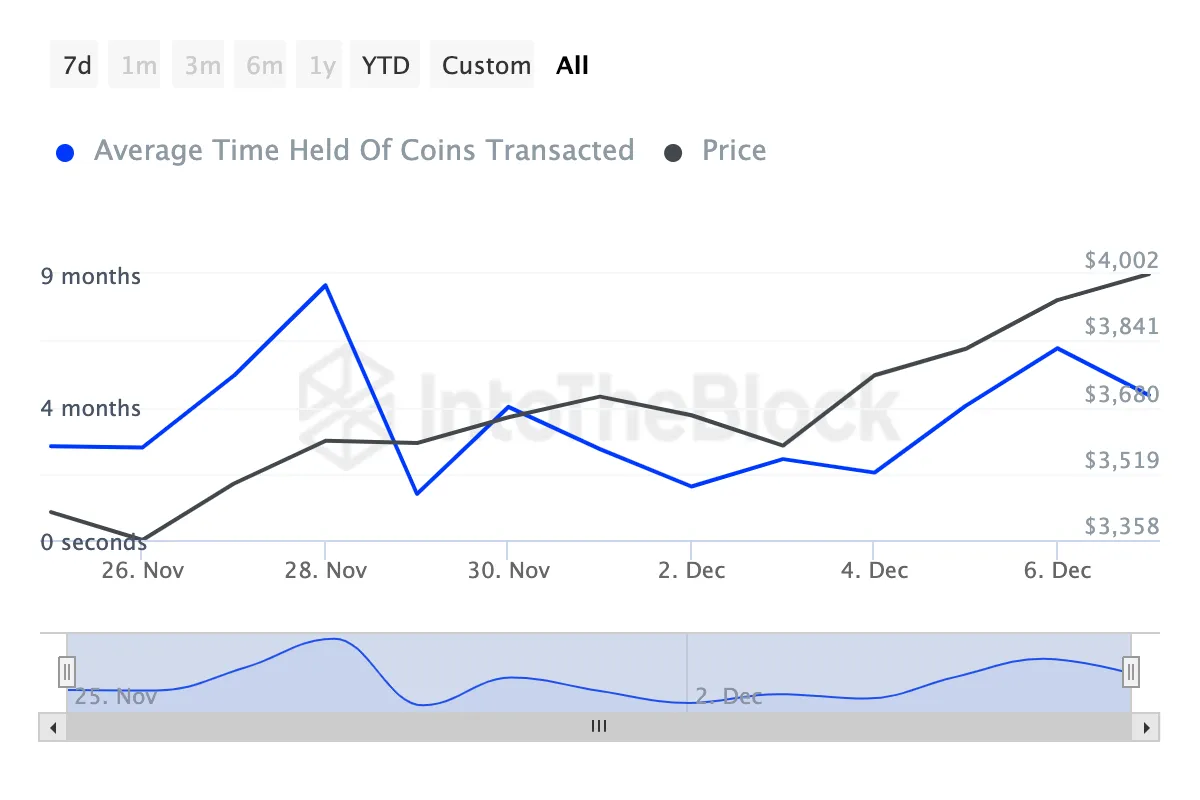
Furthermore, TinTucBitcoin’s analysis of currency holding periods also matches this trend. Currency holding period measures the time a cryptocurrency is held without being sold or traded.
When it increases, it means that most holders have decided not to sell. But when it decreases, it’s the opposite.
According to IntoTheBlock, Ethereum’s currency holding period has decreased since December 6, suggesting that the cryptocurrency is facing selling pressure. If this trend continues in the coming days, ETH price could drop below the $3,900 threshold.

ETH Price Prediction: Back Below $3,800?
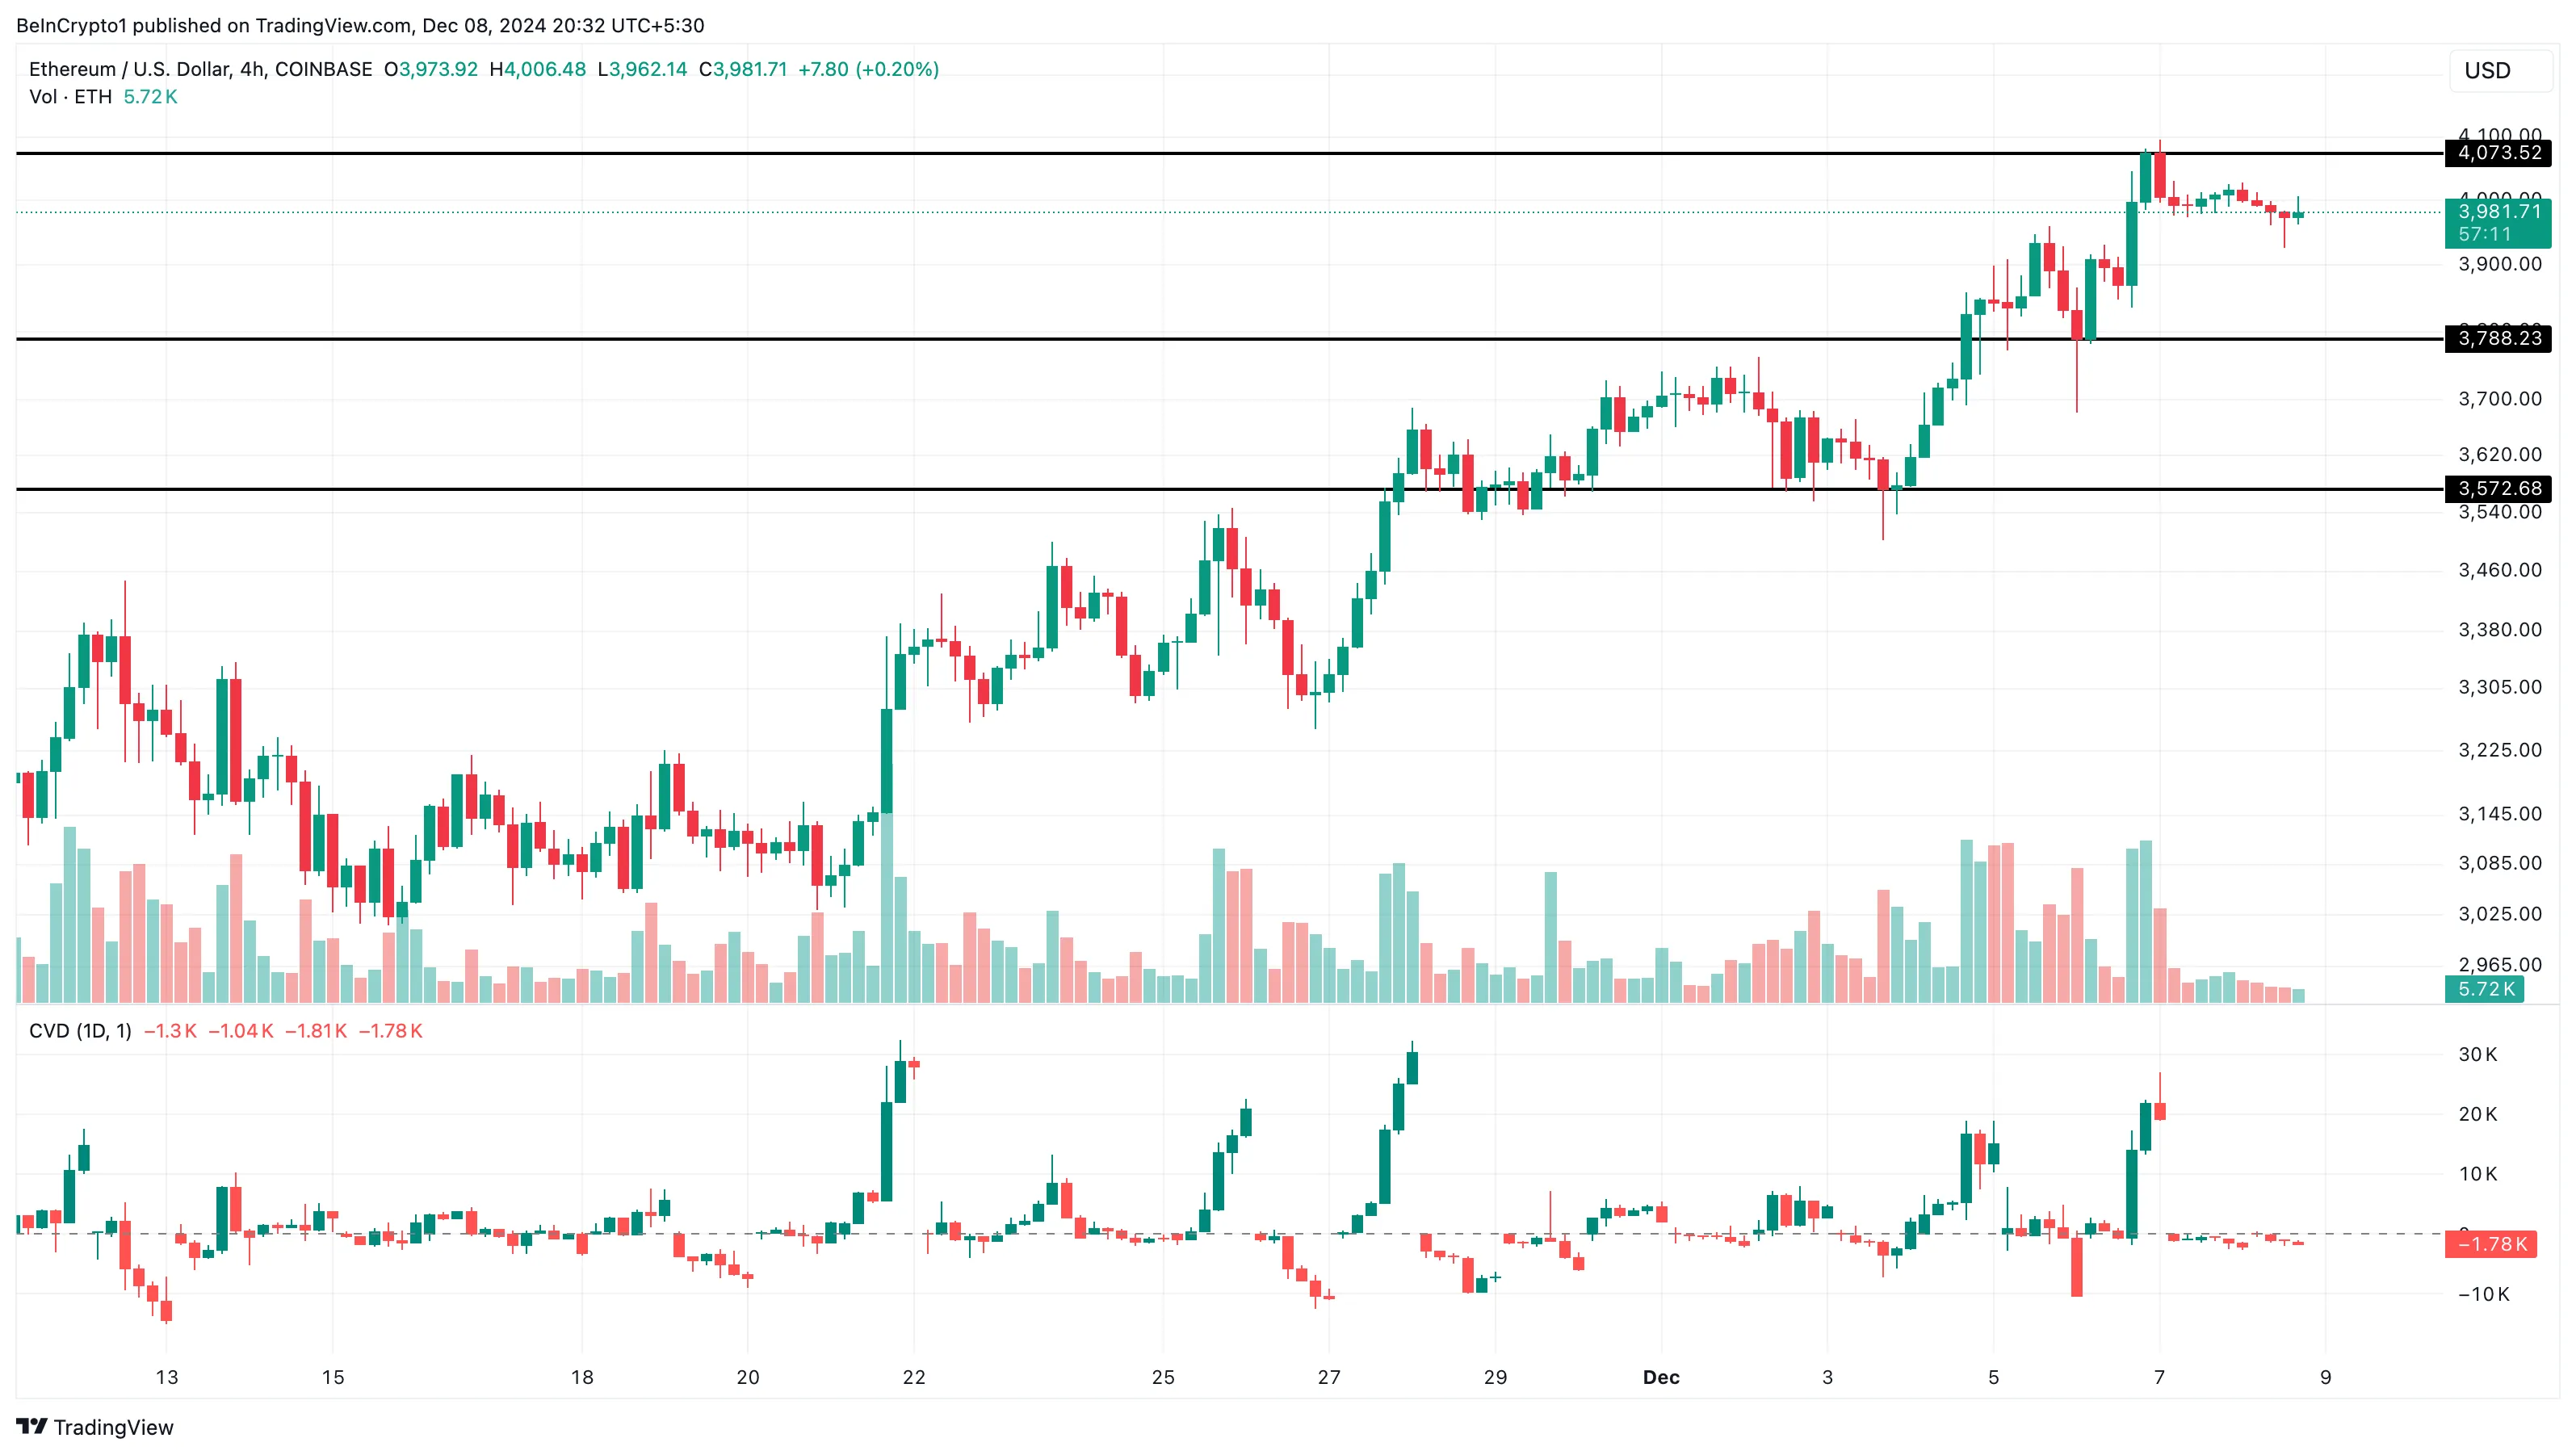
On the 4-hour chart, Ethereum’s price encountered resistance at $4,073, leading to a correction to $3,985. Additionally, the Cumulative Volume Index (CVD) has slipped into negative territory.
CVD is a technical analysis tool that provides detailed insight into buying and selling pressure in the market. With this indicator, traders can tell the difference between buying and selling volume over a specific period of time.
When CVD is positive, it means buying pressure prevails. Conversely, a negative CVD indicates increased selling pressure, as is the case with ETH.

If this situation remains the same, Ethereum price could drop to $3,788. In an extremely bearish scenario, the price could go as low as $3,572. However, if trends change, this may not happen. Instead, the cryptocurrency could rise to $4,500.
