


Solana returns to peak of 265 USD: What is the signal?
Solana (SOL) has seen a rebound in price, up 5% in the past 24 hours. At this time, the altcoin is trading at $233. Looking at the coin’s daily chart, we see st...
[ad_1]
Solana (SOL) has seen a rebound in price, up 5% in the past 24 hours. At this time, the altcoin is trading at $233.
Looking at the coin’s daily chart, we see strong indicators of bullish momentum, suggesting a recovery to reconquer the historic peak of $264.63 — last seen on the 22nd. November — may be approaching. This analysis explores the two factors driving this bullish outlook and explains why Solana could soon retest its historic price peak.
Two Key Reasons Solana Can Expand Profits
First, a bullish flag pattern has appeared on the SOL/USD daily chart, and the coin’s price is trading near the upper boundary of the pattern.
A bull flag pattern is formed after a strong price increase, followed by a period of convergence that resembles a downward sloping or horizontal flag. This pattern signals the asset to temporarily stop before potentially resuming the uptrend.
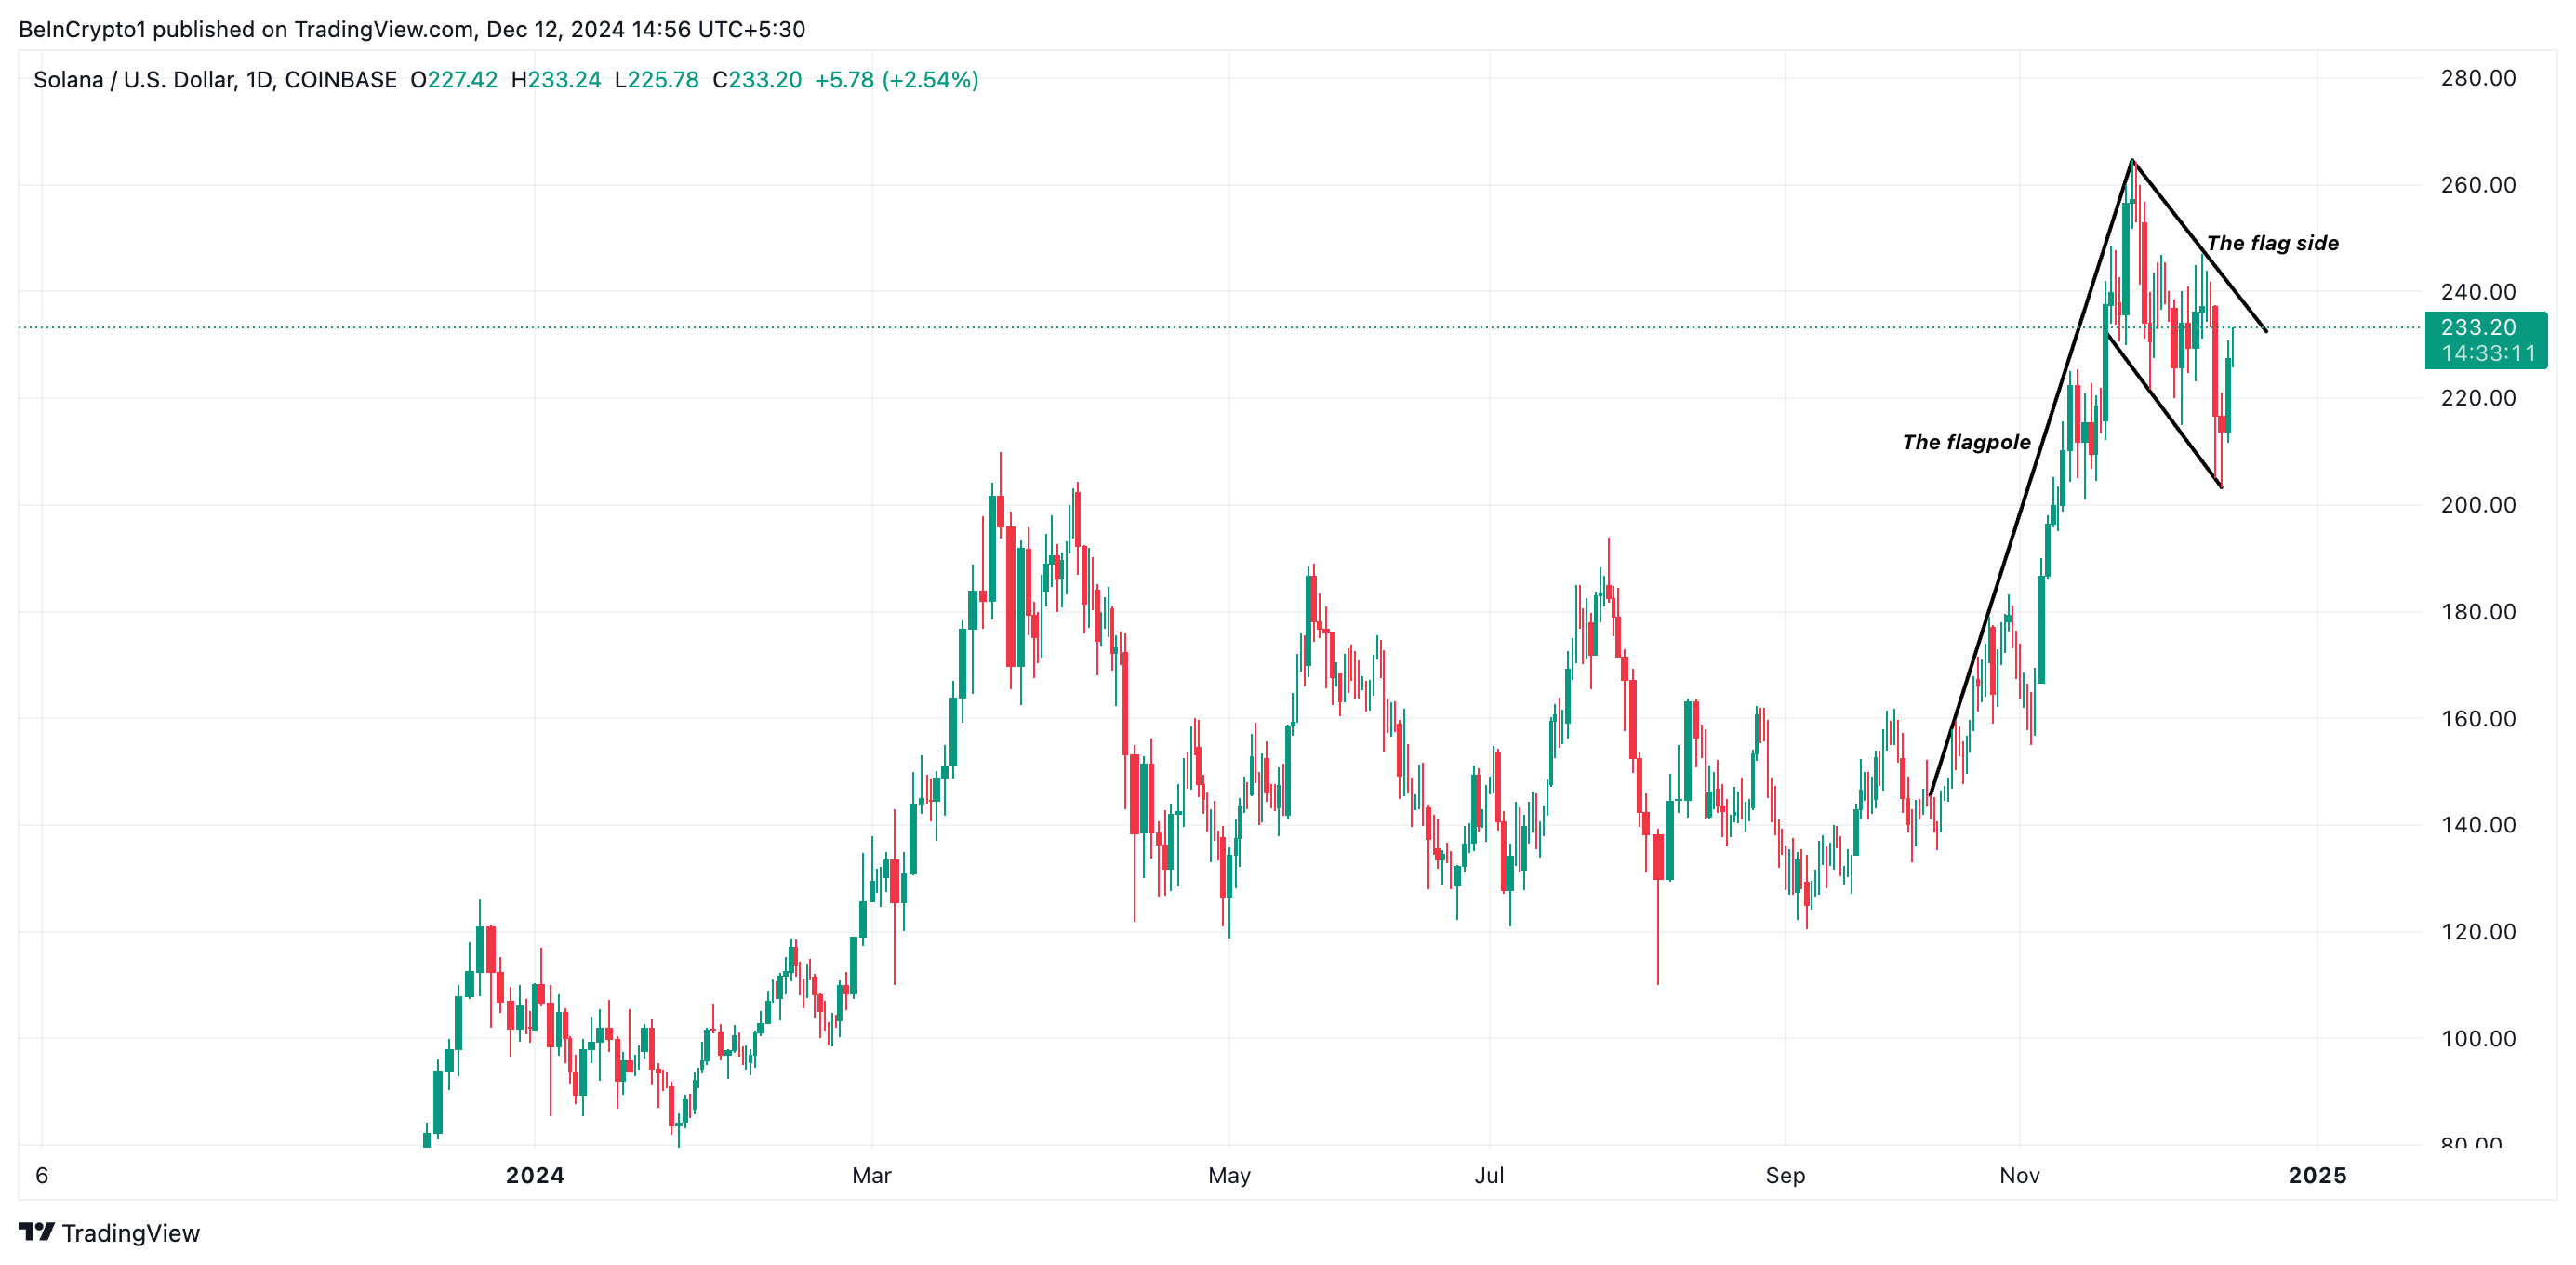
As with SOL, when the price trades near the upper boundary of the “flag” portion, this indicates strong bullish momentum, as buyers keep the price high within the converging range. A breakout above the upper line of the flag confirms this pattern and is usually accompanied by a significant price rally that mirrors the height of the previous section.
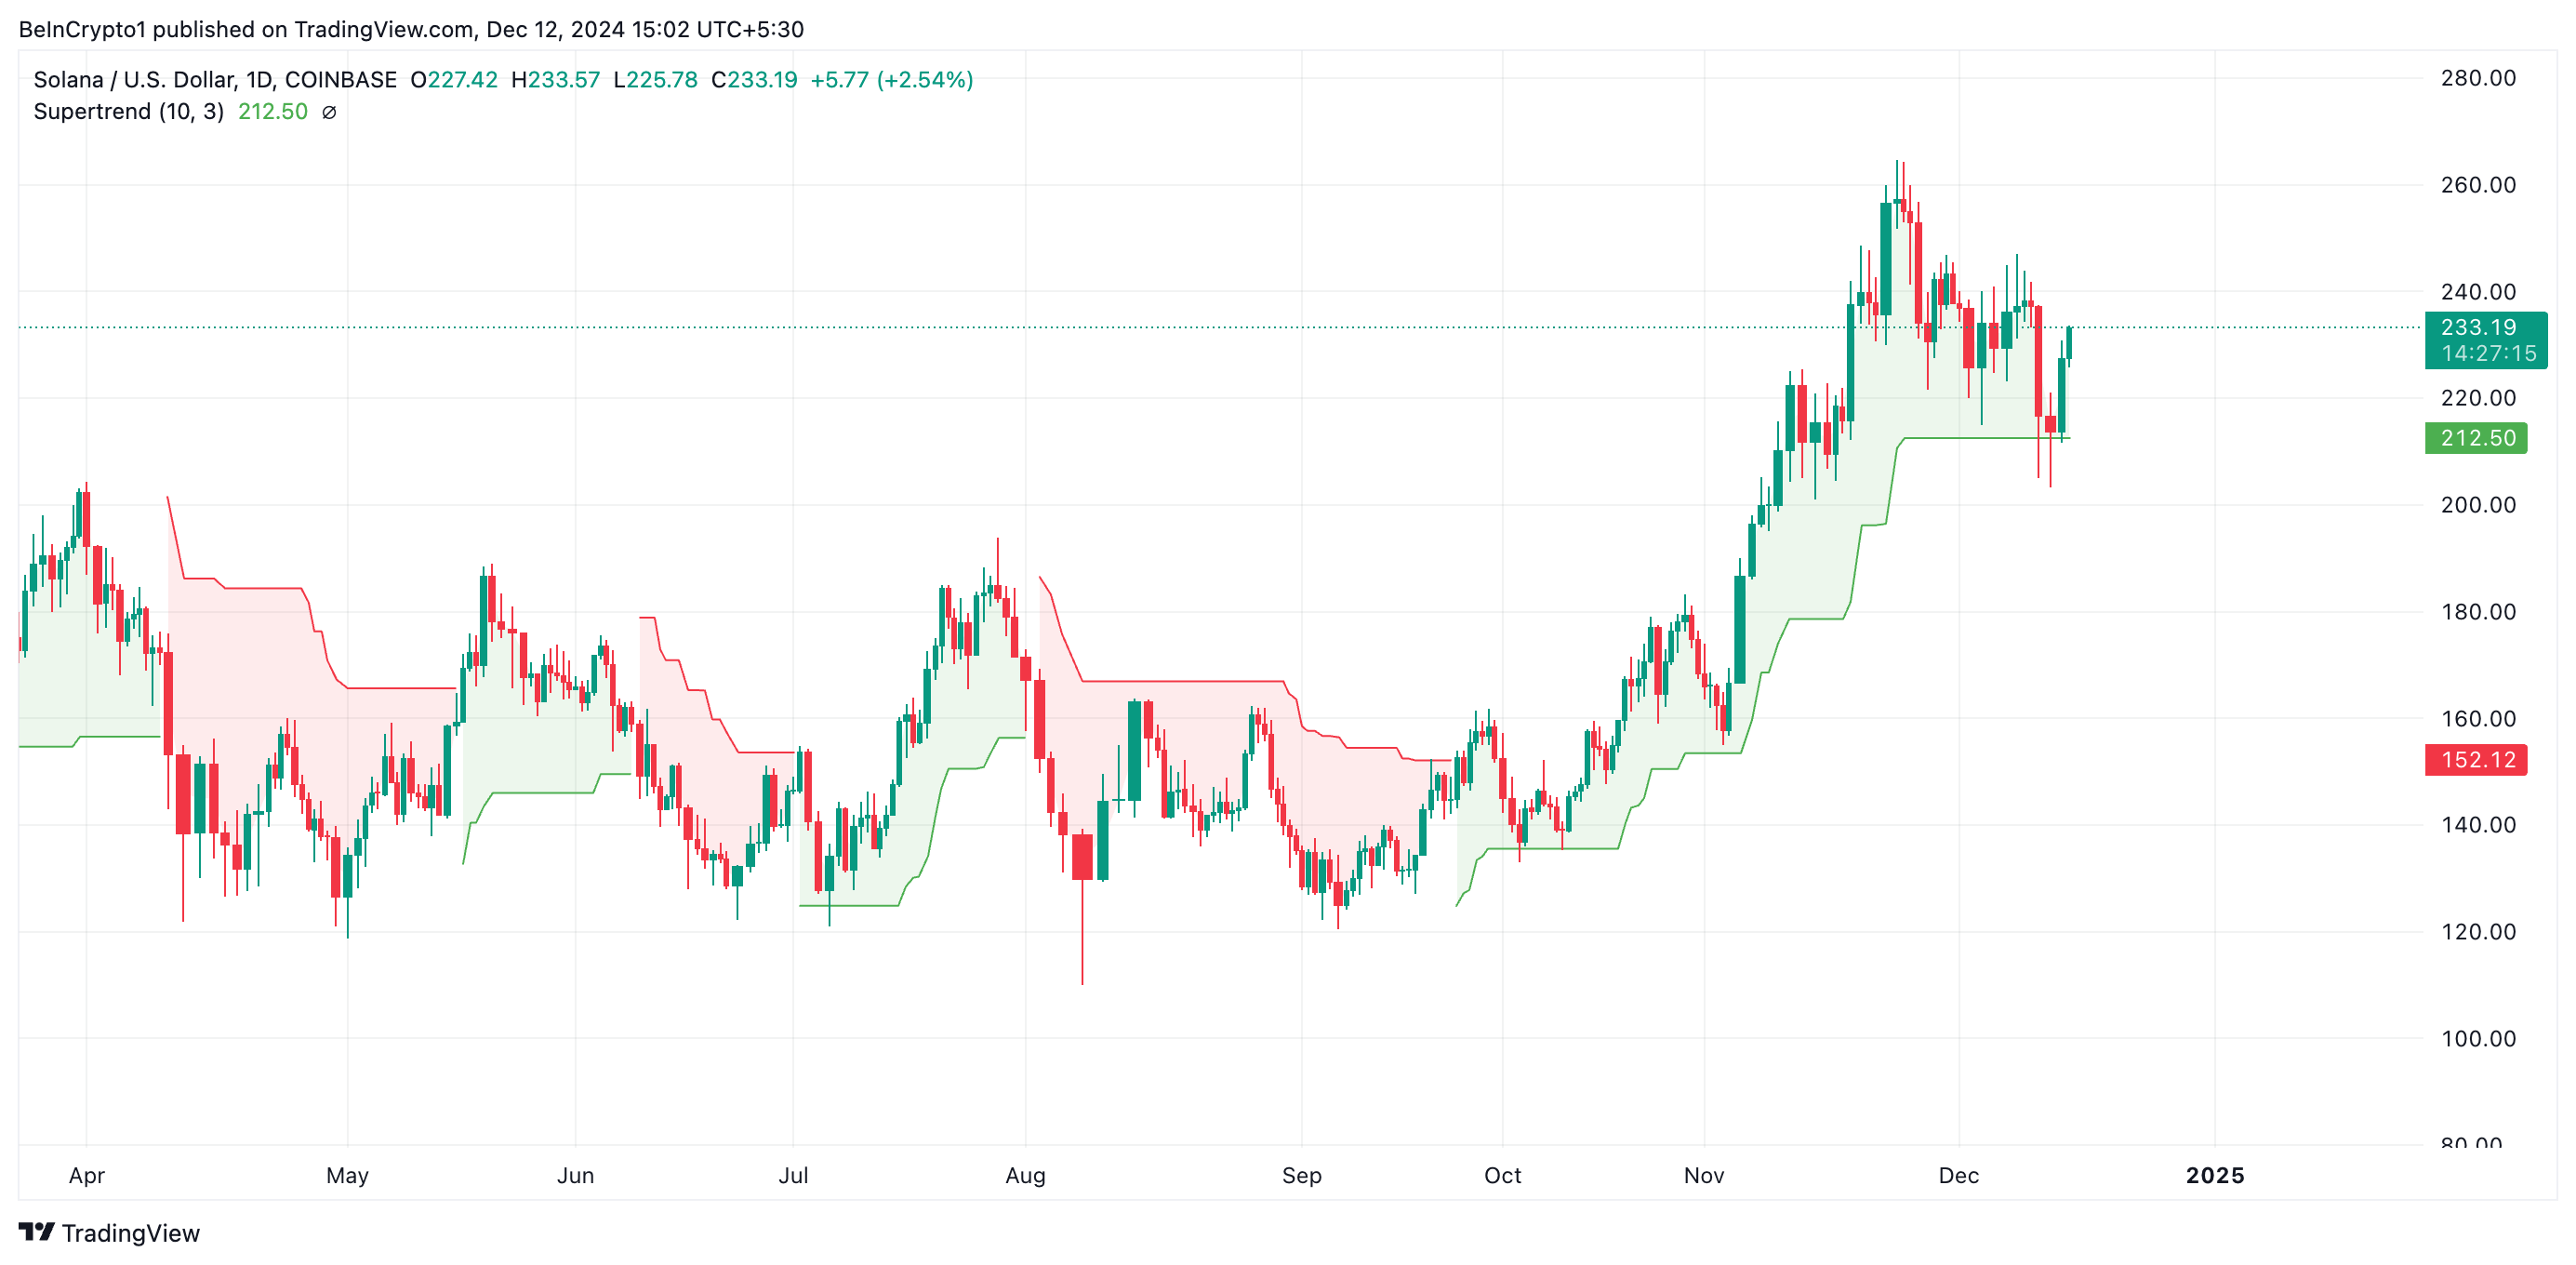
Additionally, on December 11, SOL bounced off the dynamic support that the Super Trend indicator provided at $212.50 and has since increased 10%. This indicator measures the overall direction and strength of a price trend. It appears as a line on the chart, changing color based on the current trend: green indicates an uptrend, while red shows a downtrend.
When the Supertrend line appears below the price, it acts as a support level, signaling an uptrend and showing that the price is likely to sustain above this level. As in the case of SOL, if the price respects this support level, it reinforces the bullish sentiment and hints at a continued rally.
SOL Price Prediction: Why Breaking Below the ‘Flag’ Is Dangerous
SOL is currently trading at $233.09, just above the support formed at $228.14. A successful break through the upper border of the bull flag’s convergence range would push the coin’s price towards the historic peak of $264.63.
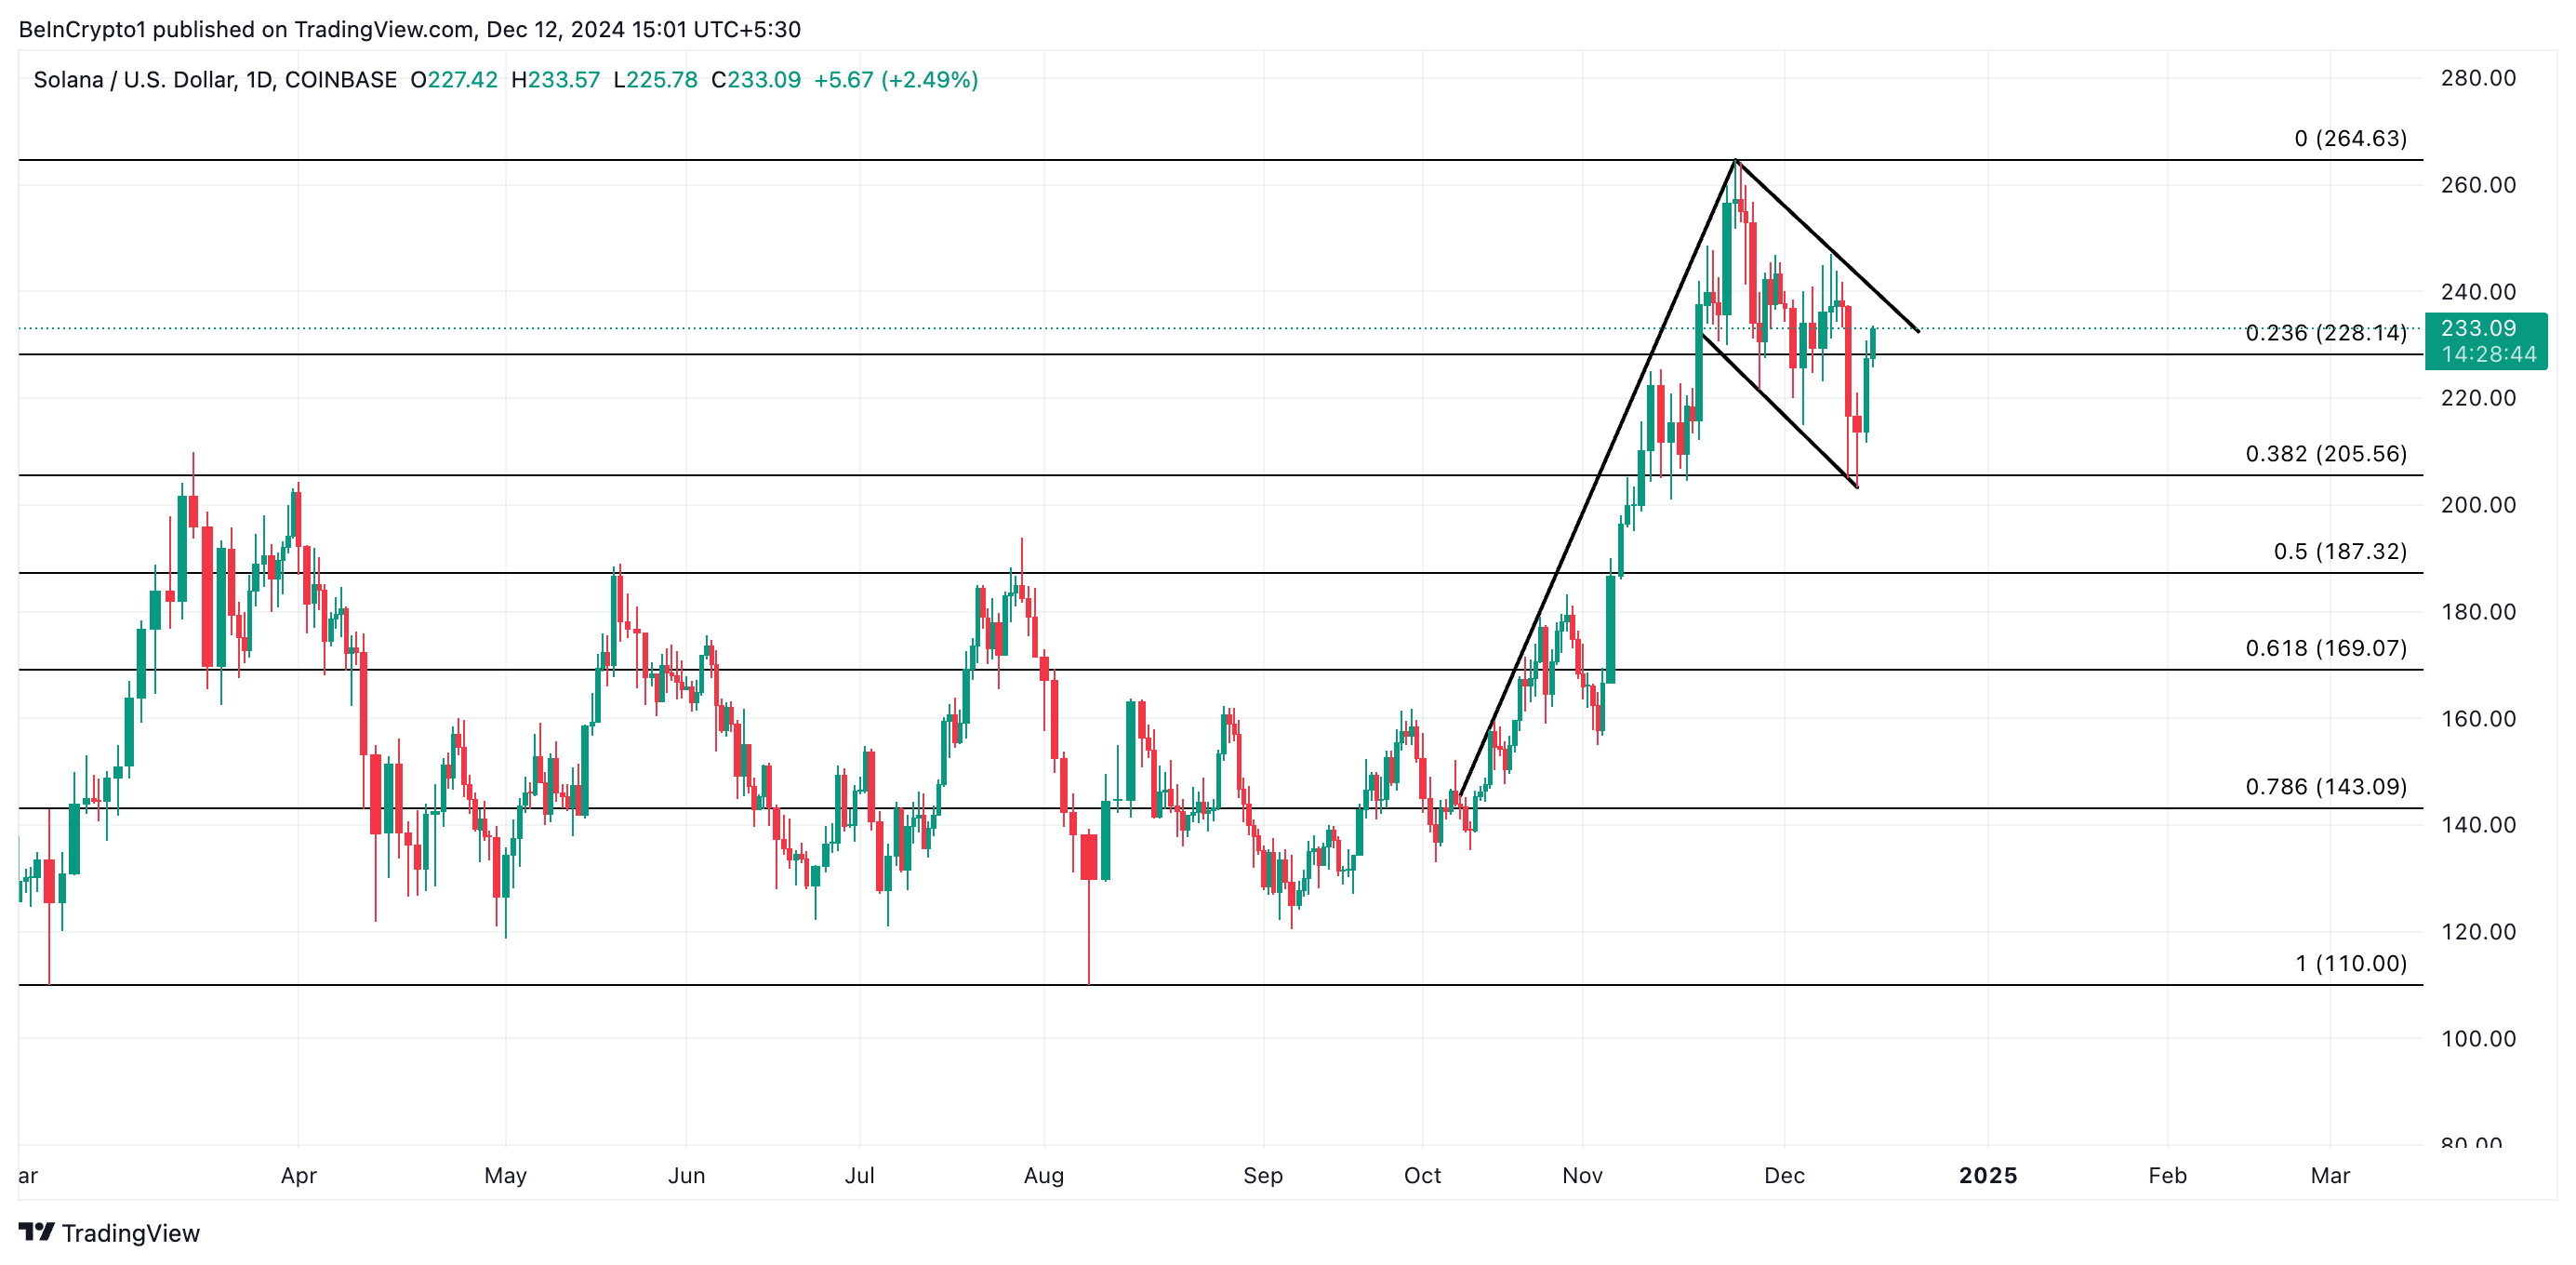
If the price of Solana falls below the “flag” side of the bullish flag pattern, it will invalidate the previously predicted positive outlook. This break would indicate that selling pressure has broken through the convergence, threatening to redirect momentum downwards. In this case, Solana copper price could drop to 187.32 USD.
General Bitcoin News
[ad_2]
More From Market

Strait of Hormuz Shipping Attack Raises Oil Supply Fears
An attack on Strait of Hormuz shipping has renewed fears for oil supplies, according to unconfirmed reports, though the specific incident behind the headline re...

Block EPS Jumps 65%, Stock Falls Despite Strong Earnings
Block reported a 65% surge in earnings per share, yet its stock fell in the wake of the results, a disconnect that made market sentiment, rather than the headli...

BTC Price Warning: 4 Reasons Bitcoin Could Drop Next Week
This BTC price warning centers on a single decision level: Bitcoin has struggled to maintain the $65,000 mark, and a four-part downside setup has traders watchi...

Crypto Price Analysis July 24: ETH, XRP, ADA, BNB, HYPE
Ethereum is the only asset in this group with a defined weekly move, up 3% but pressing into resistance, according to CryptoPotato’s July 24 price analysis . Th...

FT report: London Stock Exchange plans round-the-clock trading
The London Stock Exchange is looking at moving to round-the-clock trading, the Financial Times reported . In practice, that would mean shares could be bought an...

Bitcoin Price Analysis: BTC Bearish Below Key Reclaim
Bitcoin’s market structure remains bearish, with BTC unable to reclaim a key resistance level that would shift momentum back in favor of bulls. Until that level...

Author
Kishu Inu
Kishu Inu reports on crypto market activity, Web3 project updates, and blockchain business developments for CoinLive.