Solana (SOL) price has increased 9% in the past seven days, bringing its market capitalization back above the $100 billion mark, currently sitting at $103 billion. However, SOL’s trading volume has decreased by 34% in the past 24 hours, standing at $2.4 billion.
Positive indicators such as CMF and a recent golden cross support the bullish momentum. However, whether SOL can maintain this upward momentum or face a correction depends on its ability to hold the critical support level of $211.
Solana’s CMF Still High, But Down From Highs
Solana’s Chaikin Money Flow (CMF) index is currently at 0.23, reflecting positive inflows into the asset. CMF measures the movement of cash in and out of an asset based on price and trading volume over a given period of time. Values above zero indicate net buying pressure, while values below zero indicate net selling pressure.
SOL CMF increased from near zero on January 1 to 0.33 yesterday, indicating a sharp increase in buying momentum during this period.

At 0.23, SOL CMF remains positive, suggesting buying interest remains, albeit slightly reduced in intensity from recent highs. This could imply that buying pressure has eased a bit, potentially suggesting a period of consolidation or slowing momentum for prices.
For SOL to maintain its upward trajectory, CMF needs to stabilize or rebound, reflecting renewed investor confidence. However, a sustained decline could signal weakening demand, increasing the likelihood of a short-term price correction.
SOL Seller Shows Signs of Recovery
SOL’s Average Directional Index (ADX) rose to 45, jumping from 10.8 just four days earlier, indicating a strong trend formation. ADX measures the strength of a trend on a scale of 0 to 100, with values above 25 indicating a strong trend, while values below 20 indicate weak or non-existent momentum.
The strong increase in ADX confirms that SOL is currently in a strong uptrend, reflecting strong market activity and confidence in its price trend.

Oblique direction indicators provide greater insight into the current trend. +DI, which represents buying pressure, is at 27.5, although down from 35.8 yesterday, signaling slightly less upside momentum. Meanwhile, -DI, the selling pressure indicator, rose to 12.6 from 8.6, indicating a slight increase in extremely weak activity.
Despite these changes, the uptrend remains, with +DI still significantly higher than -DI, supported by strong ADX. However, a decreasing +DI could indicate that Solana’s upward momentum is stabilizing, and the market could enter a consolidation phase if buying pressure does not return strongly.
SOL Price Prediction: Could It Return To $246 Soon?
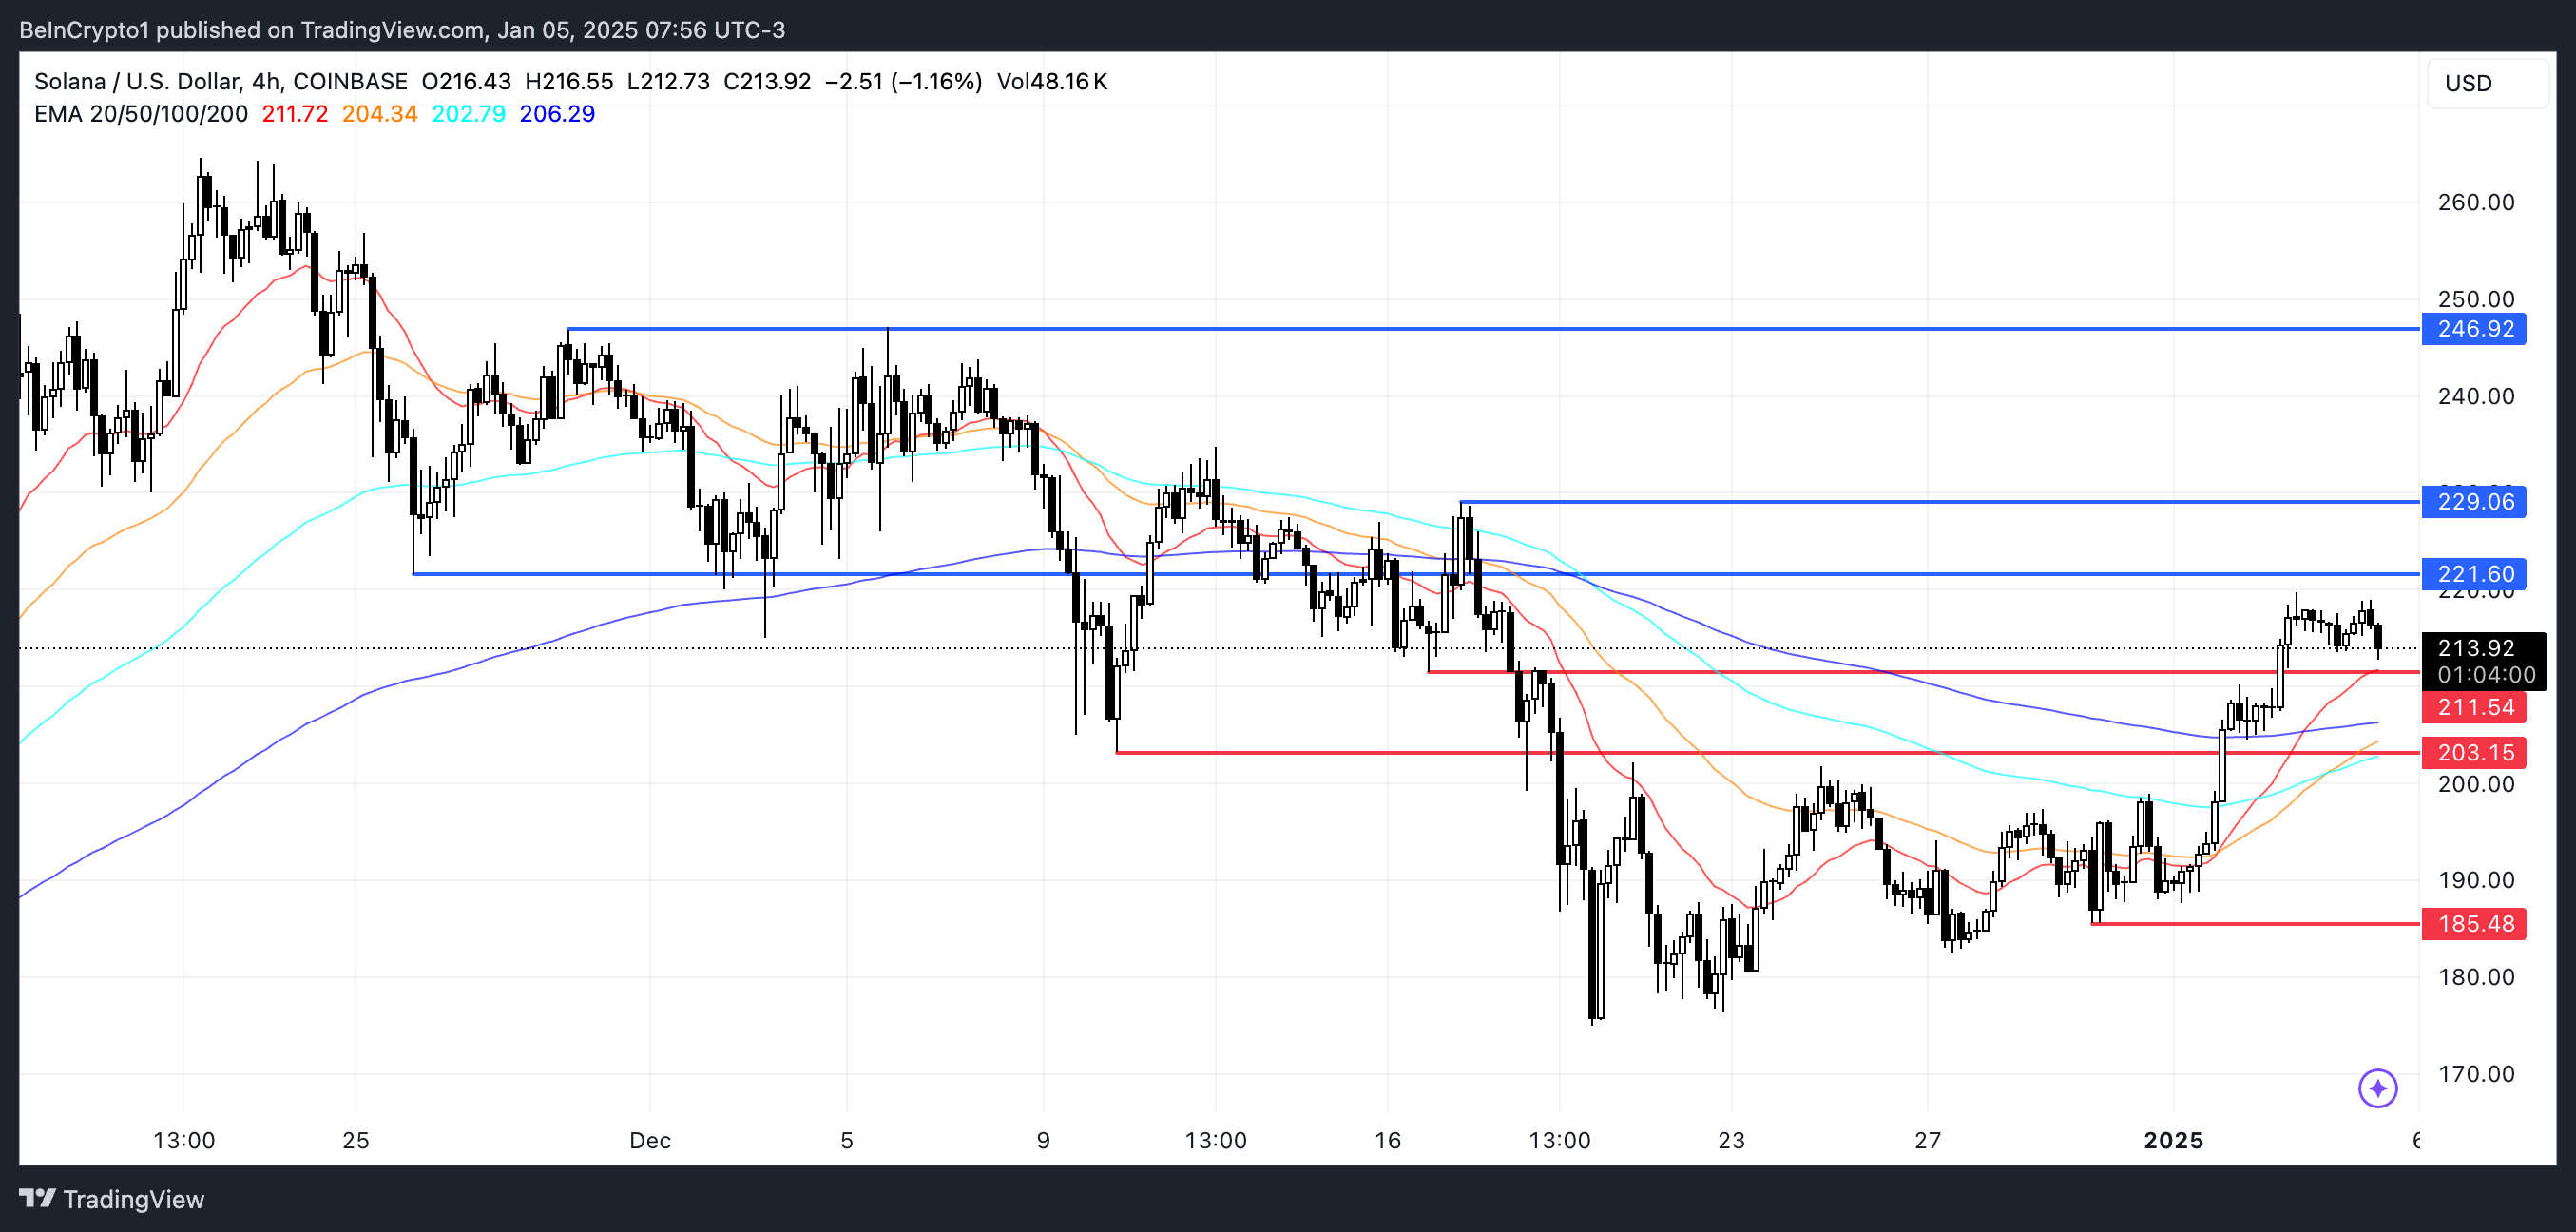
Solana’s price move depends on holding the critical support level at $211. If this support is lost, SOL could fall into a downtrend, with the next level to watch out for at $203.
Failure to hold above $203 could accelerate the decline, potentially taking the price back to $185, reflecting a significantly pleasant change in sentiment.

On the contrary, the EMA lines still maintain an uptrend, signaling optimism for the possibility of moving upward. A golden cross just formed two days ago, reinforcing the possibility of sustained upward momentum.
If the $211 support holds, SOL price could rise to challenge the resistance at $221. A break through this level could pave the way for higher profits, to $229. If the bullish momentum strengthens, Solana price could target $246, representing a 16% upside from current levels.
