


XRP Analysis: Rising Momentum Declines, Risk Below 2 USD
Ripple (XRP) is facing the risk of falling below the $2 threshold after falling 12% in the past week. This potential decline is highlighted by technical indicat...
[ad_1]
Ripple (XRP) is facing the risk of falling below the $2 threshold after falling 12% in the past week. This potential decline is highlighted by technical indicators identified in recent XRP analysis, which suggest selling pressure is increasing.
A few days ago, XRP rose to a yearly high of $2.73, sparking speculation of a possible return to $3. However, that prediction may be delayed, and here’s why.
Ripple Loses Its Preeminent Position
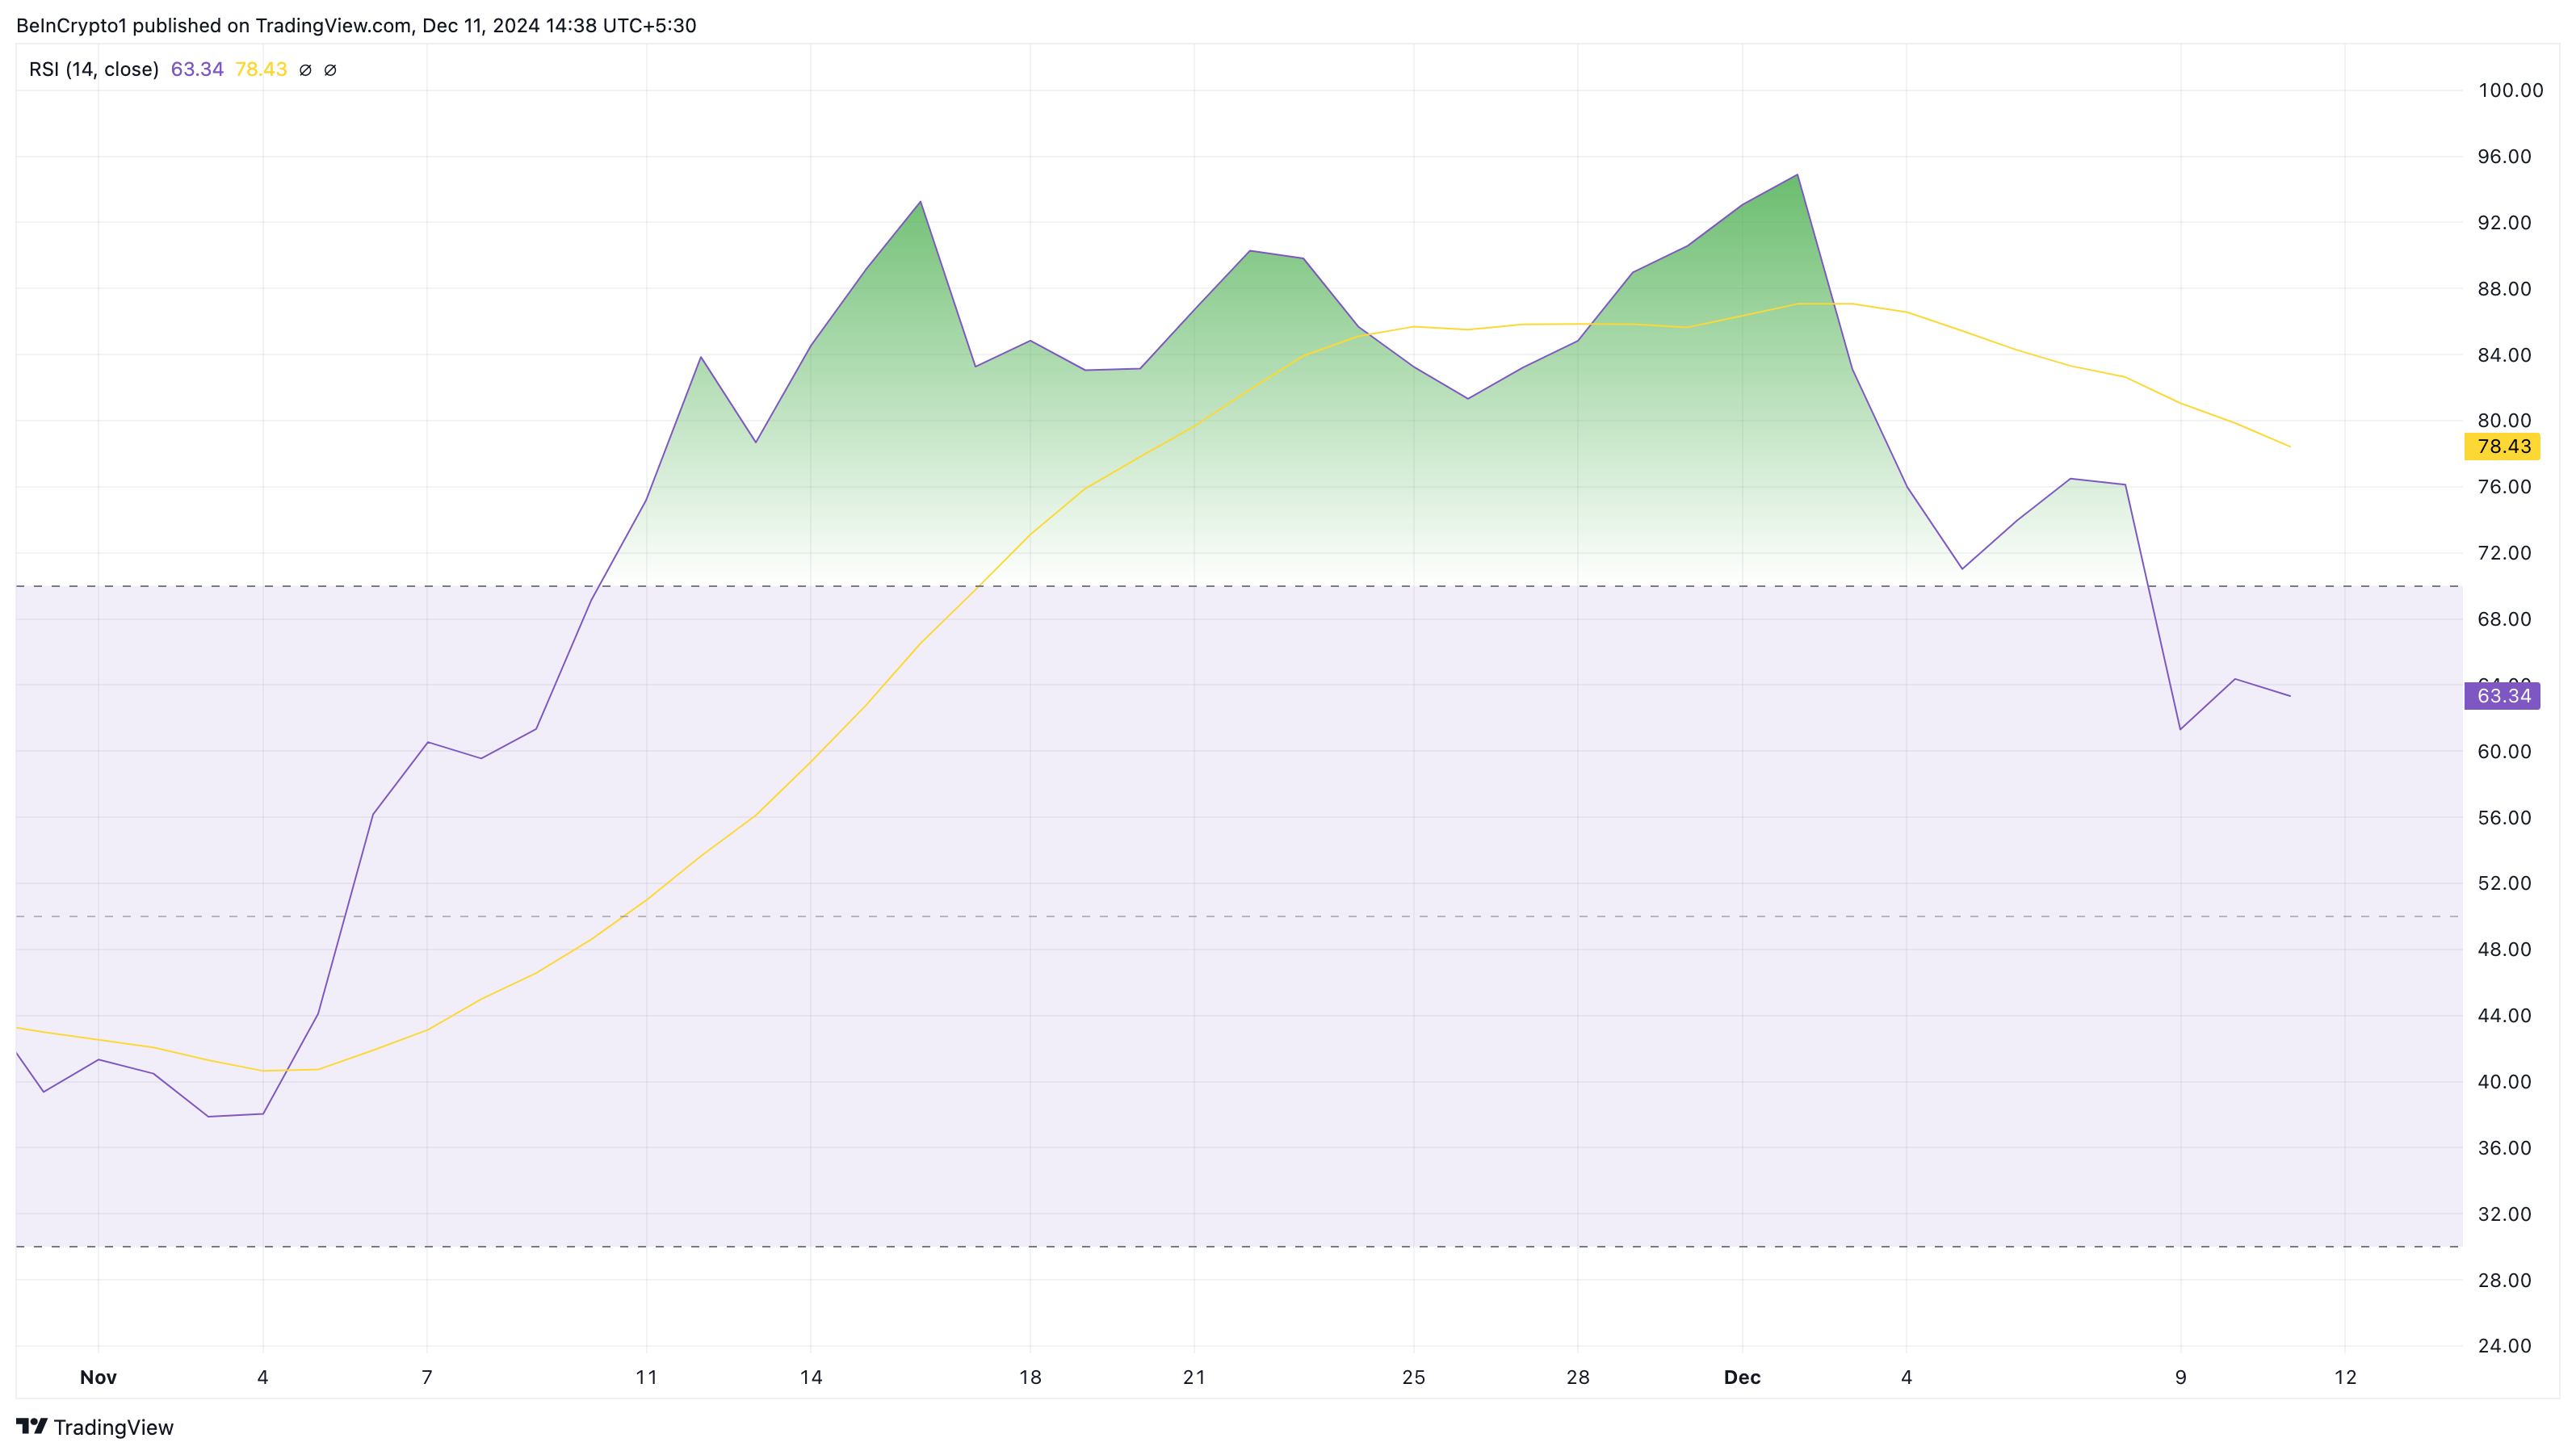
The Relative Strength Index (RSI), an indicator that measures momentum, is suggesting that XRP price could decline. RSI also shows whether an asset is overbought or oversold. When the index is above 70.00, the asset is overbought; when below 30.00, the asset is oversold.
On December 2, the RSI on the XRP/USD daily chart reached 96.25, indicating that it was overbought. This also coincides with the Token’s local peak.
As of the time of this writing, XRP price analysis shows that the index has fallen below the 50.00 neutral zone, suggesting that the momentum around it is currently decreasing. Along with that, trading volume is also decreasing, so XRP is likely to continue to fall below $2.34 in the short term.
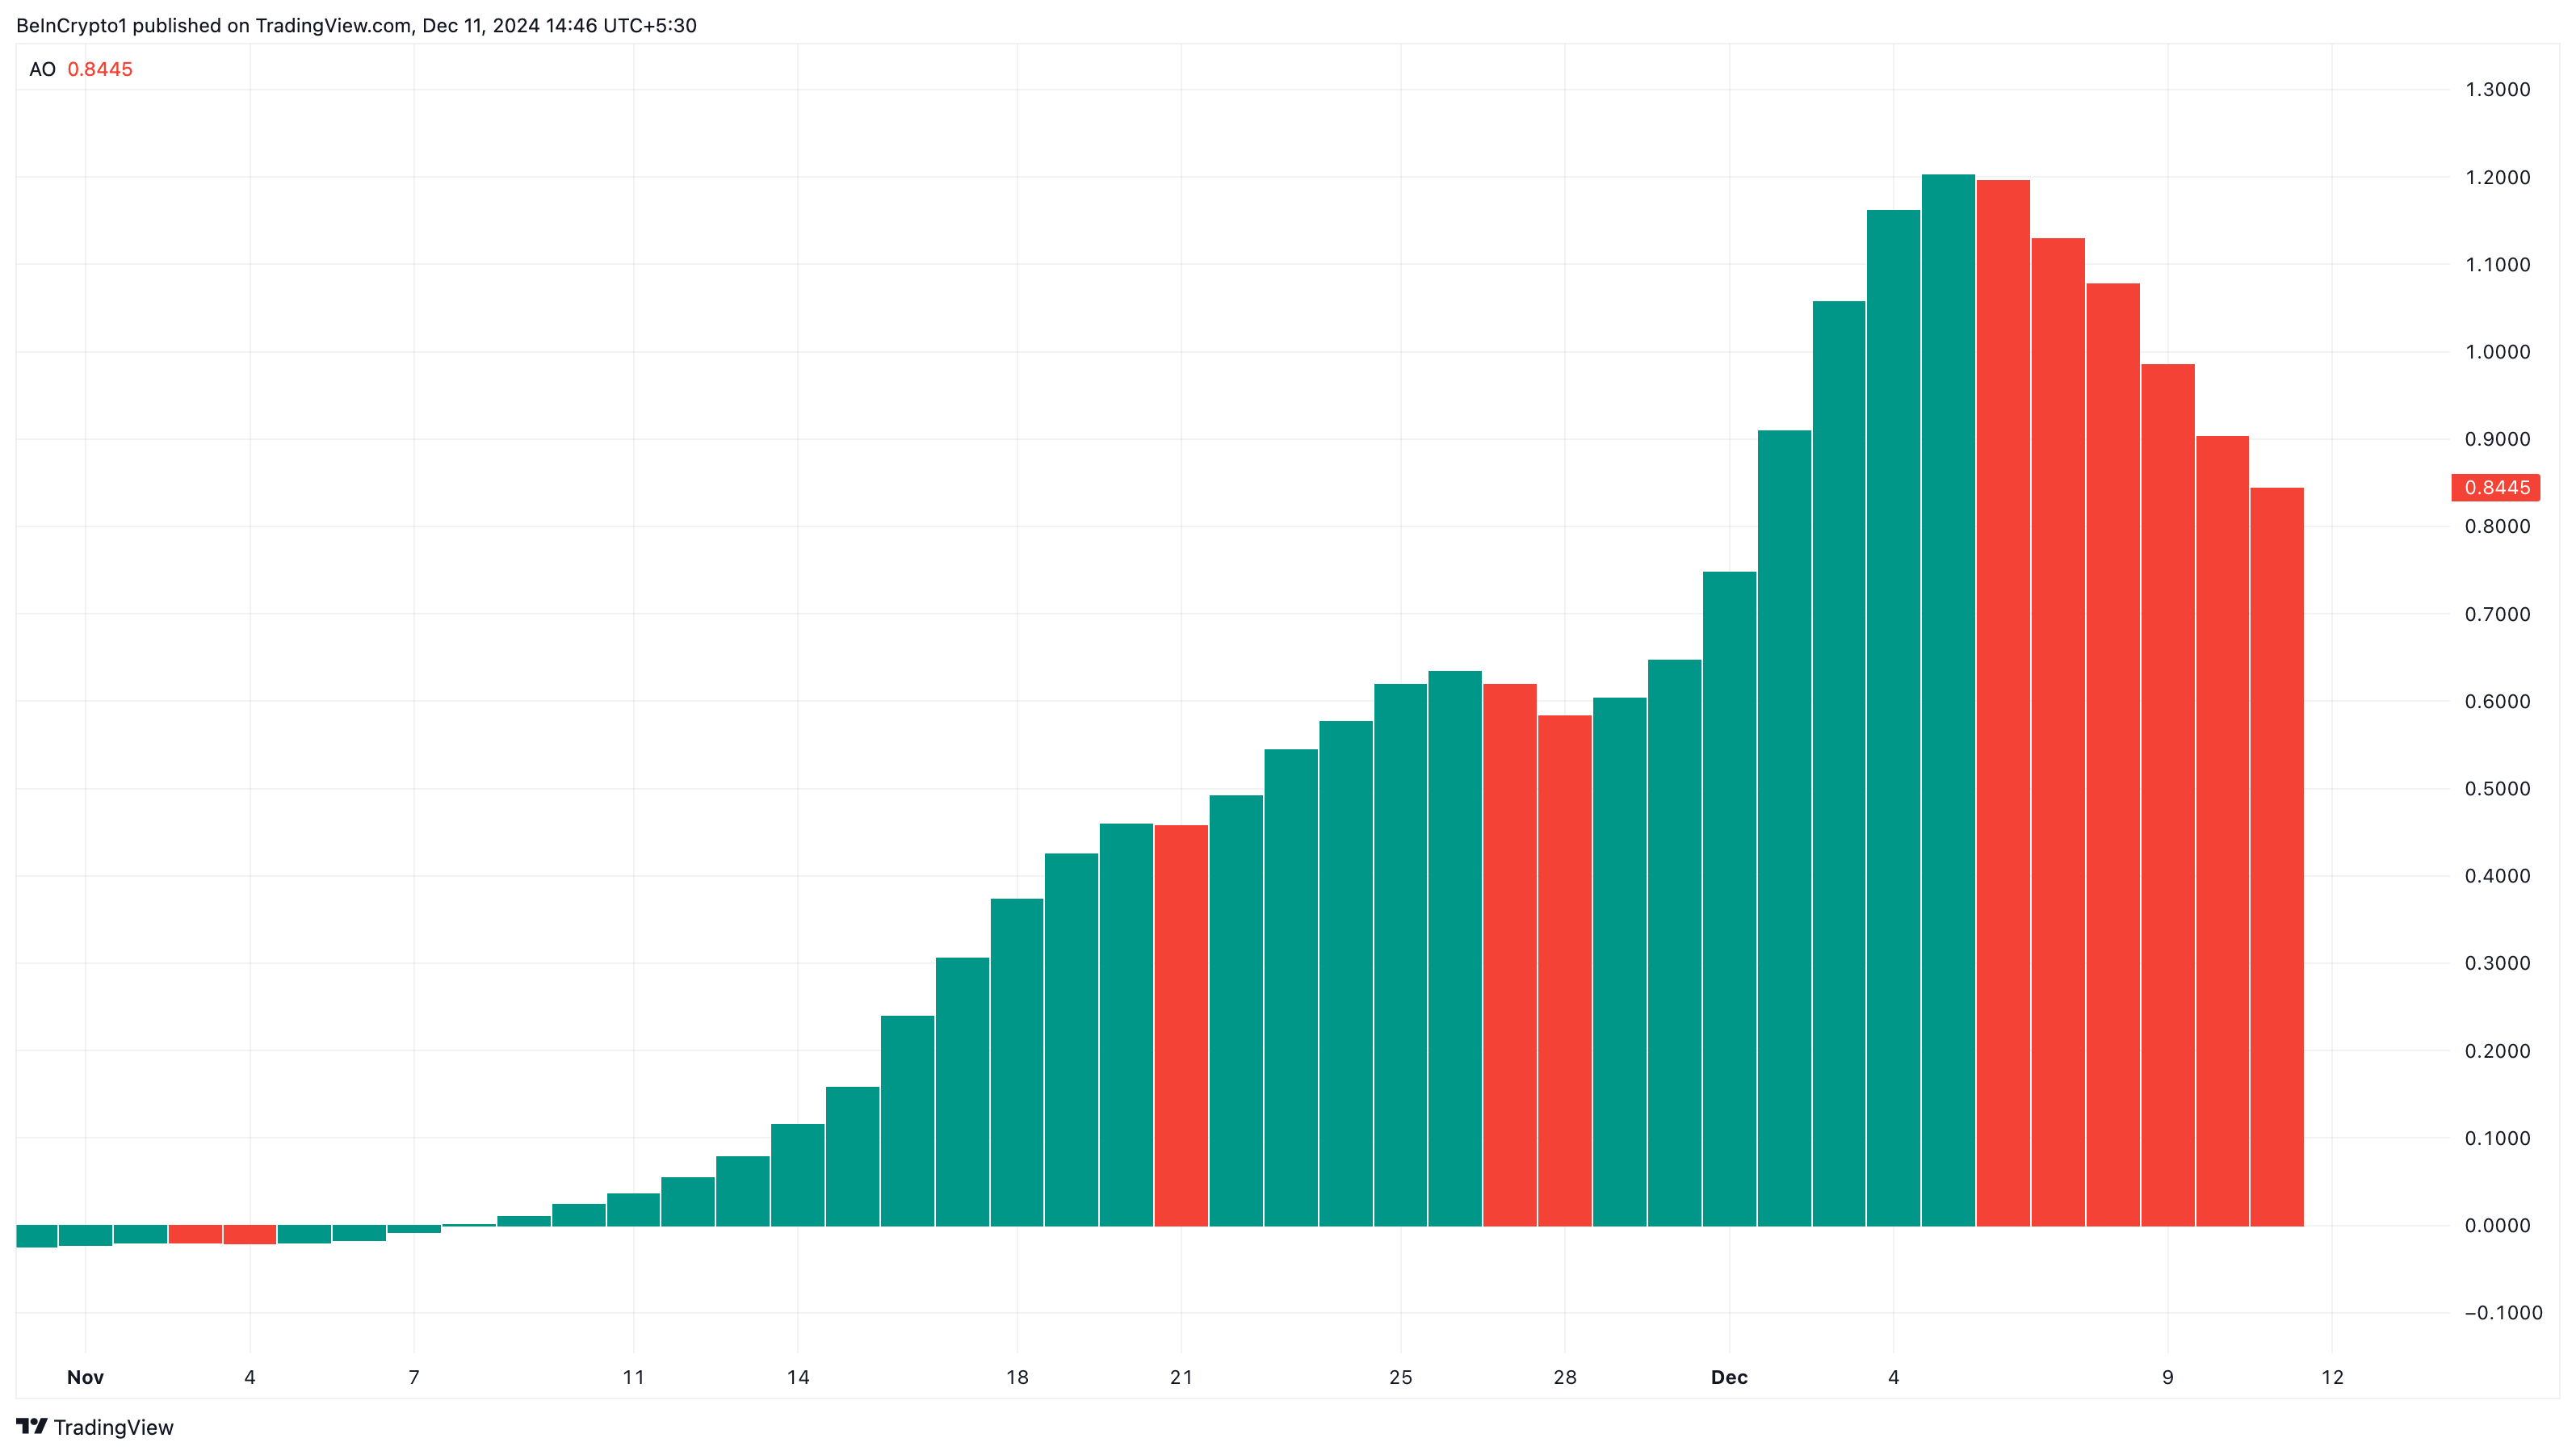
Besides the RSI, the Awesome Oscillator (AO) also forecasts that XRP could slide below the current threshold. AO is a momentum indicator that compares recent movements with historical trends.
It uses a centerline with price movements plotted on either side based on comparing two different moving averages to check whether the momentum is bullish or bearish. When AO is positive, momentum is bullish, and momentum is bearish when the indicator has negative values.
At the present time, AO is at a positive level. However, the indicator has shown bars on the chart in red, suggesting that the bullish momentum around the altcoin is weakening.
XRP Price Forecast: Lower Bottom
On the 4-hour chart, XRP has formed a head and shoulders pattern. This is a classic bullish to bearish reversal pattern, consisting of three peaks: the left shoulder, then a higher peak (head), and then a lower peak (right shoulder).
A “neckline” is drawn by connecting the lowest points of the two troughs. The slope of the neckline can be either up or down. However, a downward slope often indicates a more reliable reversal.
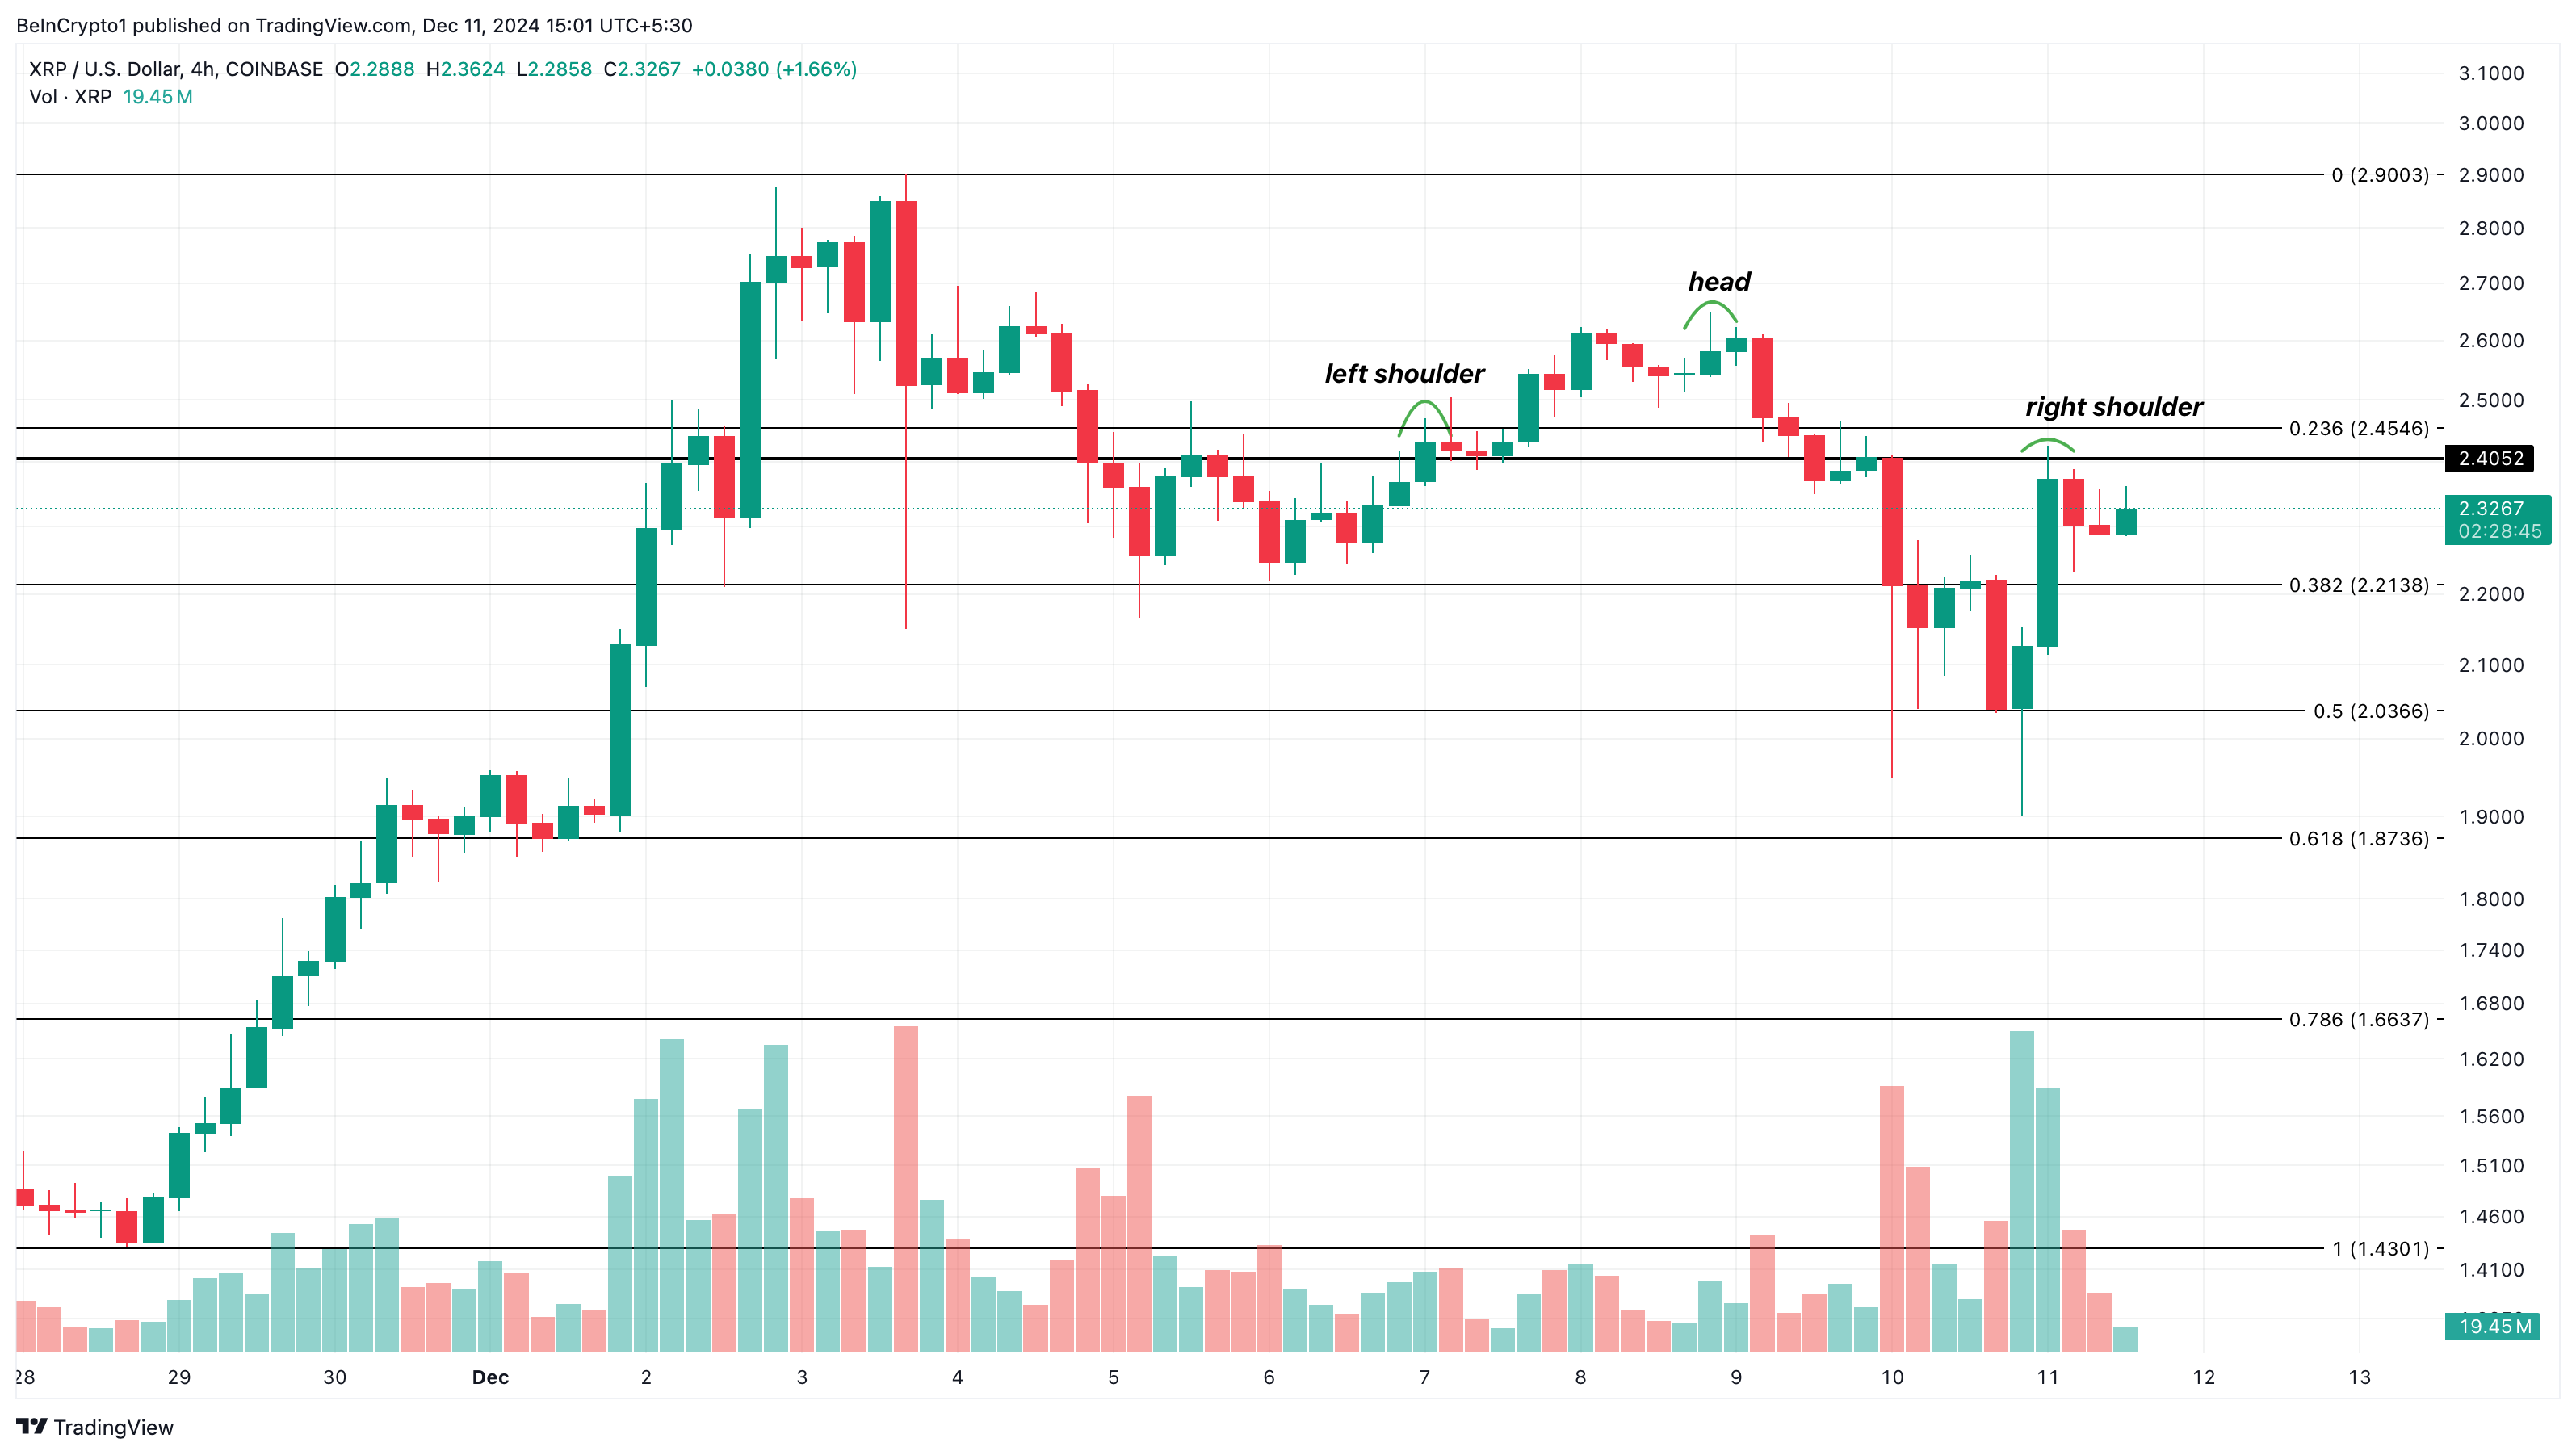
As seen below, XRP price has dropped below the neckline at $2.40, indicating weak buying. If the bulls cannot reverse this trend, the Token risks falling to $1.87. However, if buying pressure increases, XRP could climb to $2.90.
General Bitcoin News
[ad_2]
More From Market

Strait of Hormuz Shipping Attack Raises Oil Supply Fears
An attack on Strait of Hormuz shipping has renewed fears for oil supplies, according to unconfirmed reports, though the specific incident behind the headline re...

Block EPS Jumps 65%, Stock Falls Despite Strong Earnings
Block reported a 65% surge in earnings per share, yet its stock fell in the wake of the results, a disconnect that made market sentiment, rather than the headli...

BTC Price Warning: 4 Reasons Bitcoin Could Drop Next Week
This BTC price warning centers on a single decision level: Bitcoin has struggled to maintain the $65,000 mark, and a four-part downside setup has traders watchi...

Crypto Price Analysis July 24: ETH, XRP, ADA, BNB, HYPE
Ethereum is the only asset in this group with a defined weekly move, up 3% but pressing into resistance, according to CryptoPotato’s July 24 price analysis . Th...

FT report: London Stock Exchange plans round-the-clock trading
The London Stock Exchange is looking at moving to round-the-clock trading, the Financial Times reported . In practice, that would mean shares could be bought an...

Bitcoin Price Analysis: BTC Bearish Below Key Reclaim
Bitcoin’s market structure remains bearish, with BTC unable to reclaim a key resistance level that would shift momentum back in favor of bulls. Until that level...

Author
Kishu Inu
Kishu Inu reports on crypto market activity, Web3 project updates, and blockchain business developments for CoinLive.