Ripple’s XRP has seen a significant surge, with a 25% increase over the past seven days, peaking at $2.72. However, recent data suggests that XRP’s price jump may have reached a local peak due to changes in the status of several indices.
While the altcoin’s long-term outlook is likely to remain positive, investors need to be cautious about expectations for further short-term returns. Here’s why.
Ripple tokens become overvalued, buying pressure decreases
One indicator that XRP may stall is the Network Value to Transactions (NVT) ratio. The NVT ratio tests whether the market capitalization of a cryptocurrency is growing faster than its trading volume. This is an important indicator to evaluate whether a currency is overvalued or undervalued.
When this ratio decreases, it means that transaction volume on the blockchain has grown faster than market capitalization. In this case, it means that the cryptocurrency is undervalued, and the price may increase in the near future.
However, with XRP, the NVT ratio has increased from 30.68 to 71.65 over the past three days. This notable increase suggests that the cryptocurrency’s market capitalization has grown faster than transactions on the network, suggesting that XRP’s price jump may be pausing and that the altcoin is likely nearing its peak. local.

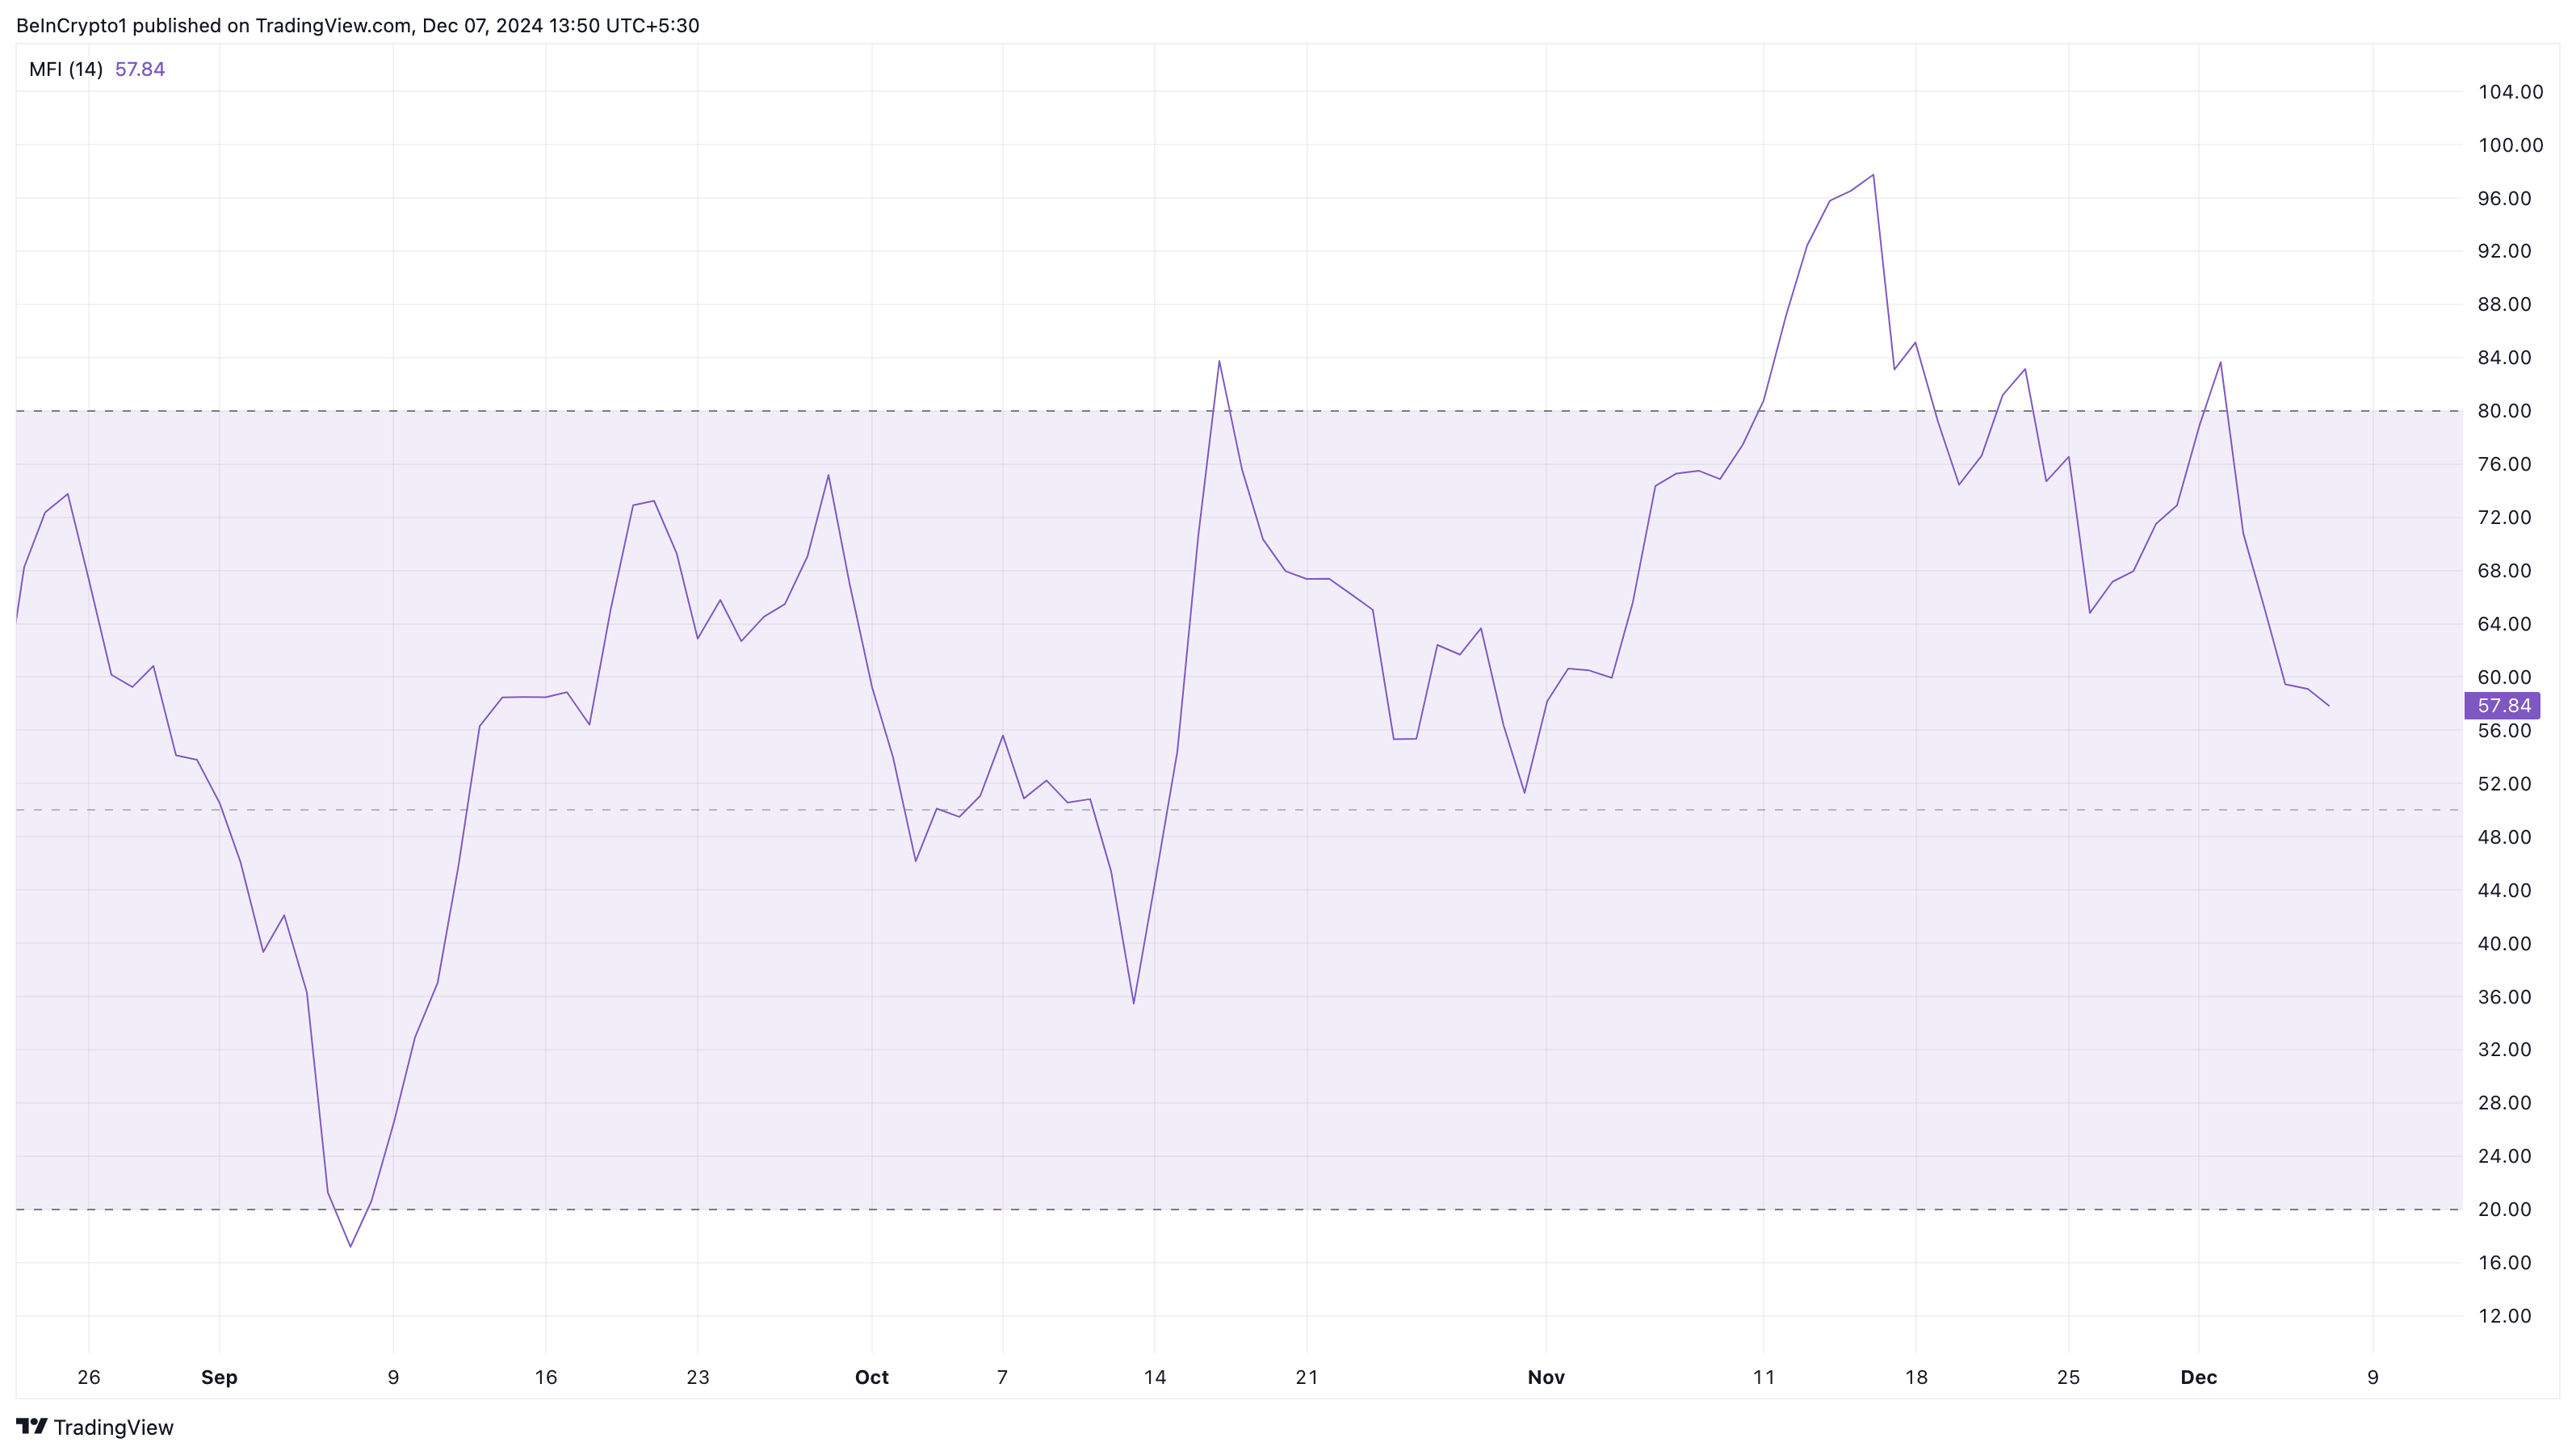
Furthermore, the Money Flow Index (MFI) on the daily chart seems to support this idea. The MFI is a technical oscillator that uses price and volume to measure buying and selling pressure.
With this data, the index can tell when a cryptocurrency is overbought or oversold. When reading above 80.00, it is overbought. On the other hand, when below 20.00, it is oversold.
According to the chart below, the MFI on the daily chart of XRP/USD reached 83.20 on December 3, suggesting that the altcoin was overbought. Since then, the index has declined, showing that buying pressure is no longer as high as it was a few days ago. If the decline continues, XRP price may find it difficult to climb further.

XRP Price Prediction: Sub-$2 is approaching
Further review on the daily chart shows that XRP’s correction from $2.72 has helped it find support at $2.25. However, the image below shows lower trading volume around the altcoin, suggesting that a new XRP bull run may not be imminent in the short term.
Instead, the bears may try to push the price below the support that the bulls are defending. If it happens, XRP price could drop to $1.85, where the 23.6% Fibonacci ratio is located.
If selling pressure intensifies, the Token’s next target could be around $1.40 at the 38.2% Fibonacci level. However, if buying pressure increases and the MFI index recovers, this prediction may not come true. In that case, XRP could surge past $2.90 and reach its highest peak of the year, hitting $3.20.