


XRP Price Drops 8%: Important Support Point
XRP price has experienced a significant decline, falling more than 8% in the past seven days after reaching a six-year high on December 17. The recent decline b...
[ad_1]
XRP price has experienced a significant decline, falling more than 8% in the past seven days after reaching a six-year high on December 17. The recent decline brings XRP close to key support at 2.17 USD, a key price point that can determine the short-term trend.
Despite this pullback, momentum indicators such as RSI and CMF show mixed signals, with some signs of recovery but not strong enough to confirm a strong uptrend. As investors watch closely, XRP’s ability to hold support or regain its late-December uptrend will be a key factor in shaping its next moves.
XRP RSI Is Currently Neutral
XRP’s Relative Strength Index (RSI) has spiked to 43.12, up sharply from below 20 just three days earlier. This significant increase indicates a strong movement in momentum. When RSI is below 20, it usually indicates that the asset has been oversold, which could be a sign of a sharp decline in extreme market sentiment or disengagement by market participants.
The recovery to 43.12 reflects a return of buying interest, suggesting investors may be entering at lower levels as an opportunity.
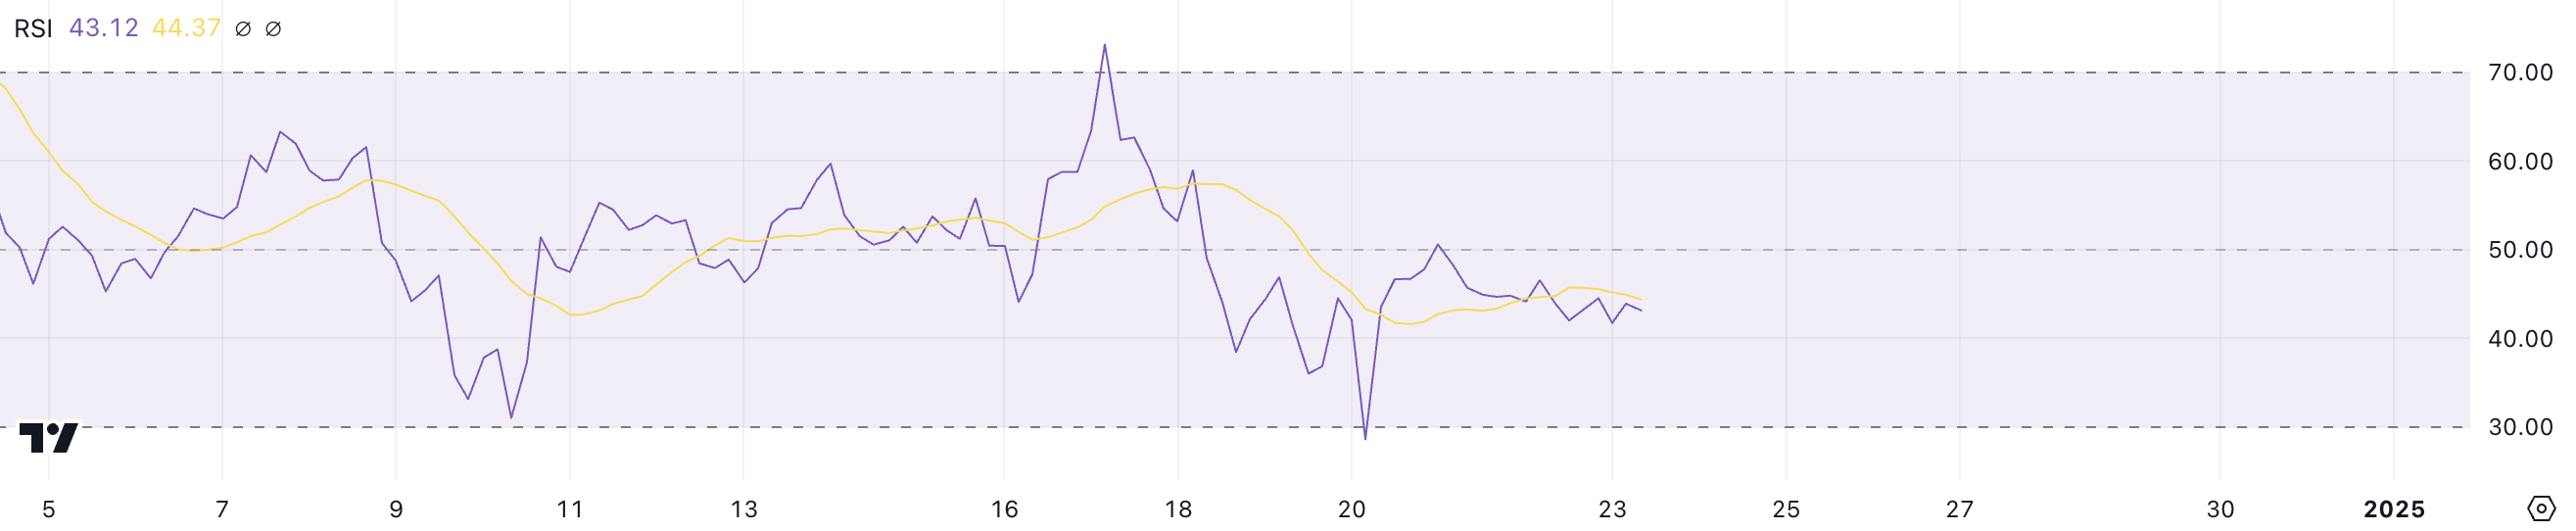
RSI is a momentum oscillator used to gauge the speed and scale of recent price changes. It ranges from 0 to 100, with important thresholds typically being 30 and 70. Readings below 30 indicate an oversold condition, where the price may have fallen too quickly and may be about to reverse or bounce.
Conversely, readings above 70 imply an overbought condition, where prices may have increased too much and could face downward pressure. XRP RSI at 43.12 puts it in the neutral range, neither oversold nor overbought.
XRP’s CMF Index Is Positive, But Not Too Strong
The Chaikin Money Flow (CMF) index for XRP is currently at 0.04, a neutral level that reflects a slight predominance of buying pressure. This comes after it hit a high of 0.11 just a day earlier, signaling stronger accumulation at that time, and a notable rebound from -0.13 on December 20 , when selling pressure is dominant.
The progression from negative to positive values highlights the change in market sentiment, with capital flows tilting towards buyers over the past few days. However, the drop from 0.11 to 0.04 shows that while buying interest remains, it has abated somewhat, possibly indicating a period of consolidation for XRP in the short term.
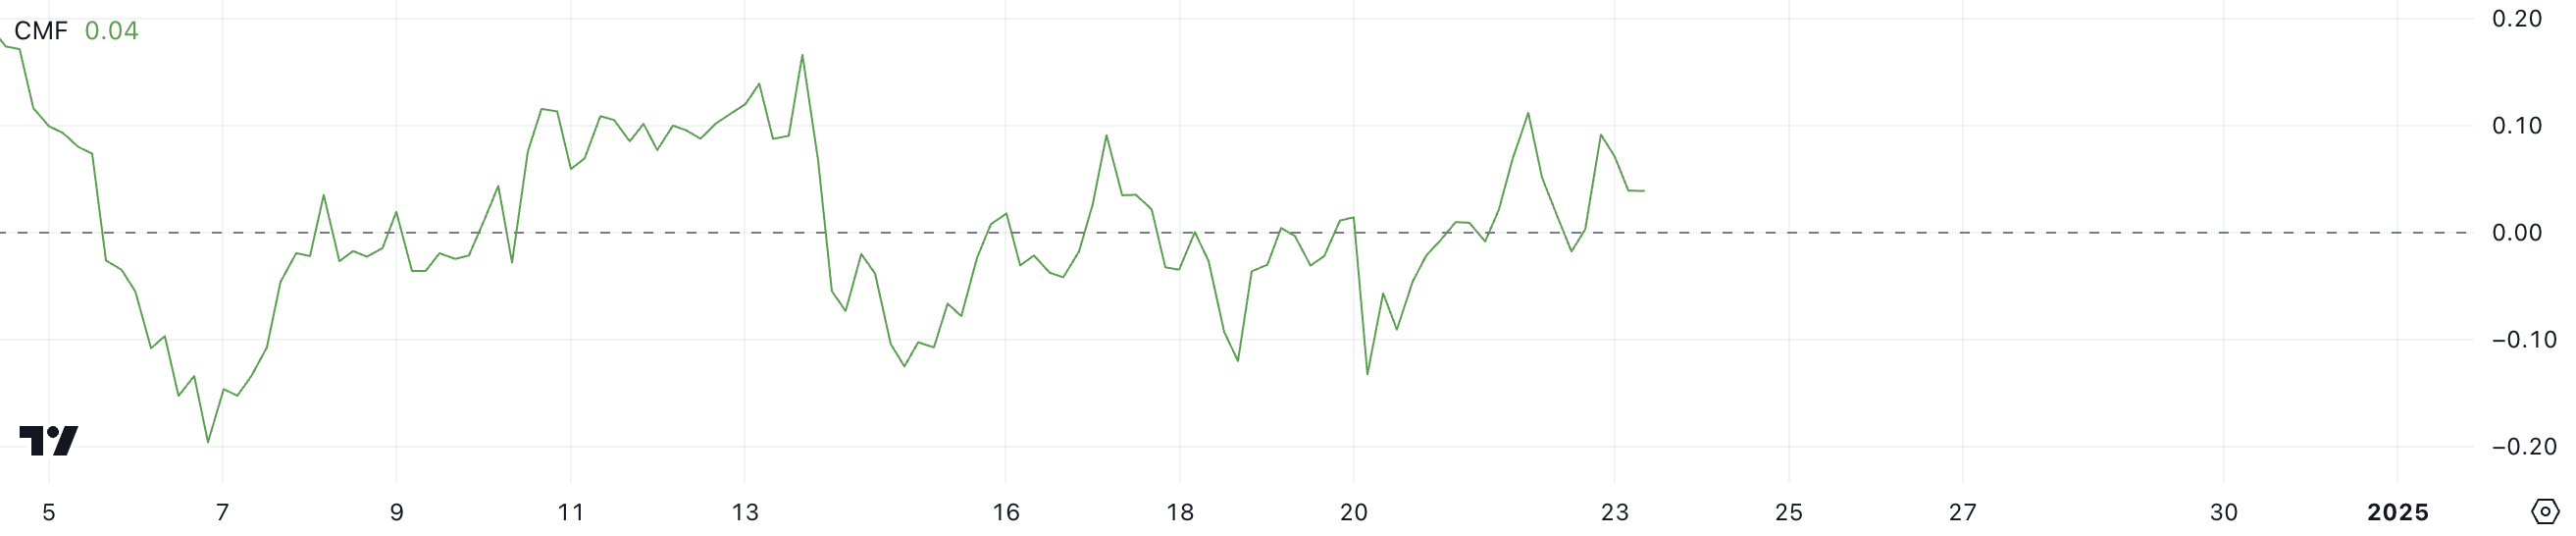
CMF is an indicator used to evaluate the strength of buying or selling pressure by analyzing both price and volume over a specific period. It fluctuates between -1 and +1, with positive values representing net buying pressure and negative values reflecting net selling pressure. A CMF above zero typically indicates that more money is flowing into the asset, indicating accumulation, while a CMF below zero indicates distribution.
XRP’s current CMF is 0.04, which is slightly above which means buying activity is slightly stronger than selling. While it shows interest from buyers, the move down from 0.11 could imply a weakening of growth momentum, which could lead to a sideways move in price or a need for strong volume. than to maintain any upward movement.
XRP Price Forecast: Could XRP Price Fall Below 2 USD?
Support at $2.17 is the key point for the current stability of XRP price. If this level fails to hold, it could trigger a significant downside move, with the next strong support identified at $1.89. This would represent a potential 13% correction, suggesting that market sentiment could turn bearish and lead to additional selling pressure.
Support levels like $2.17 often act as psychological and technical barriers that buyers must defend to prevent a deeper decline.
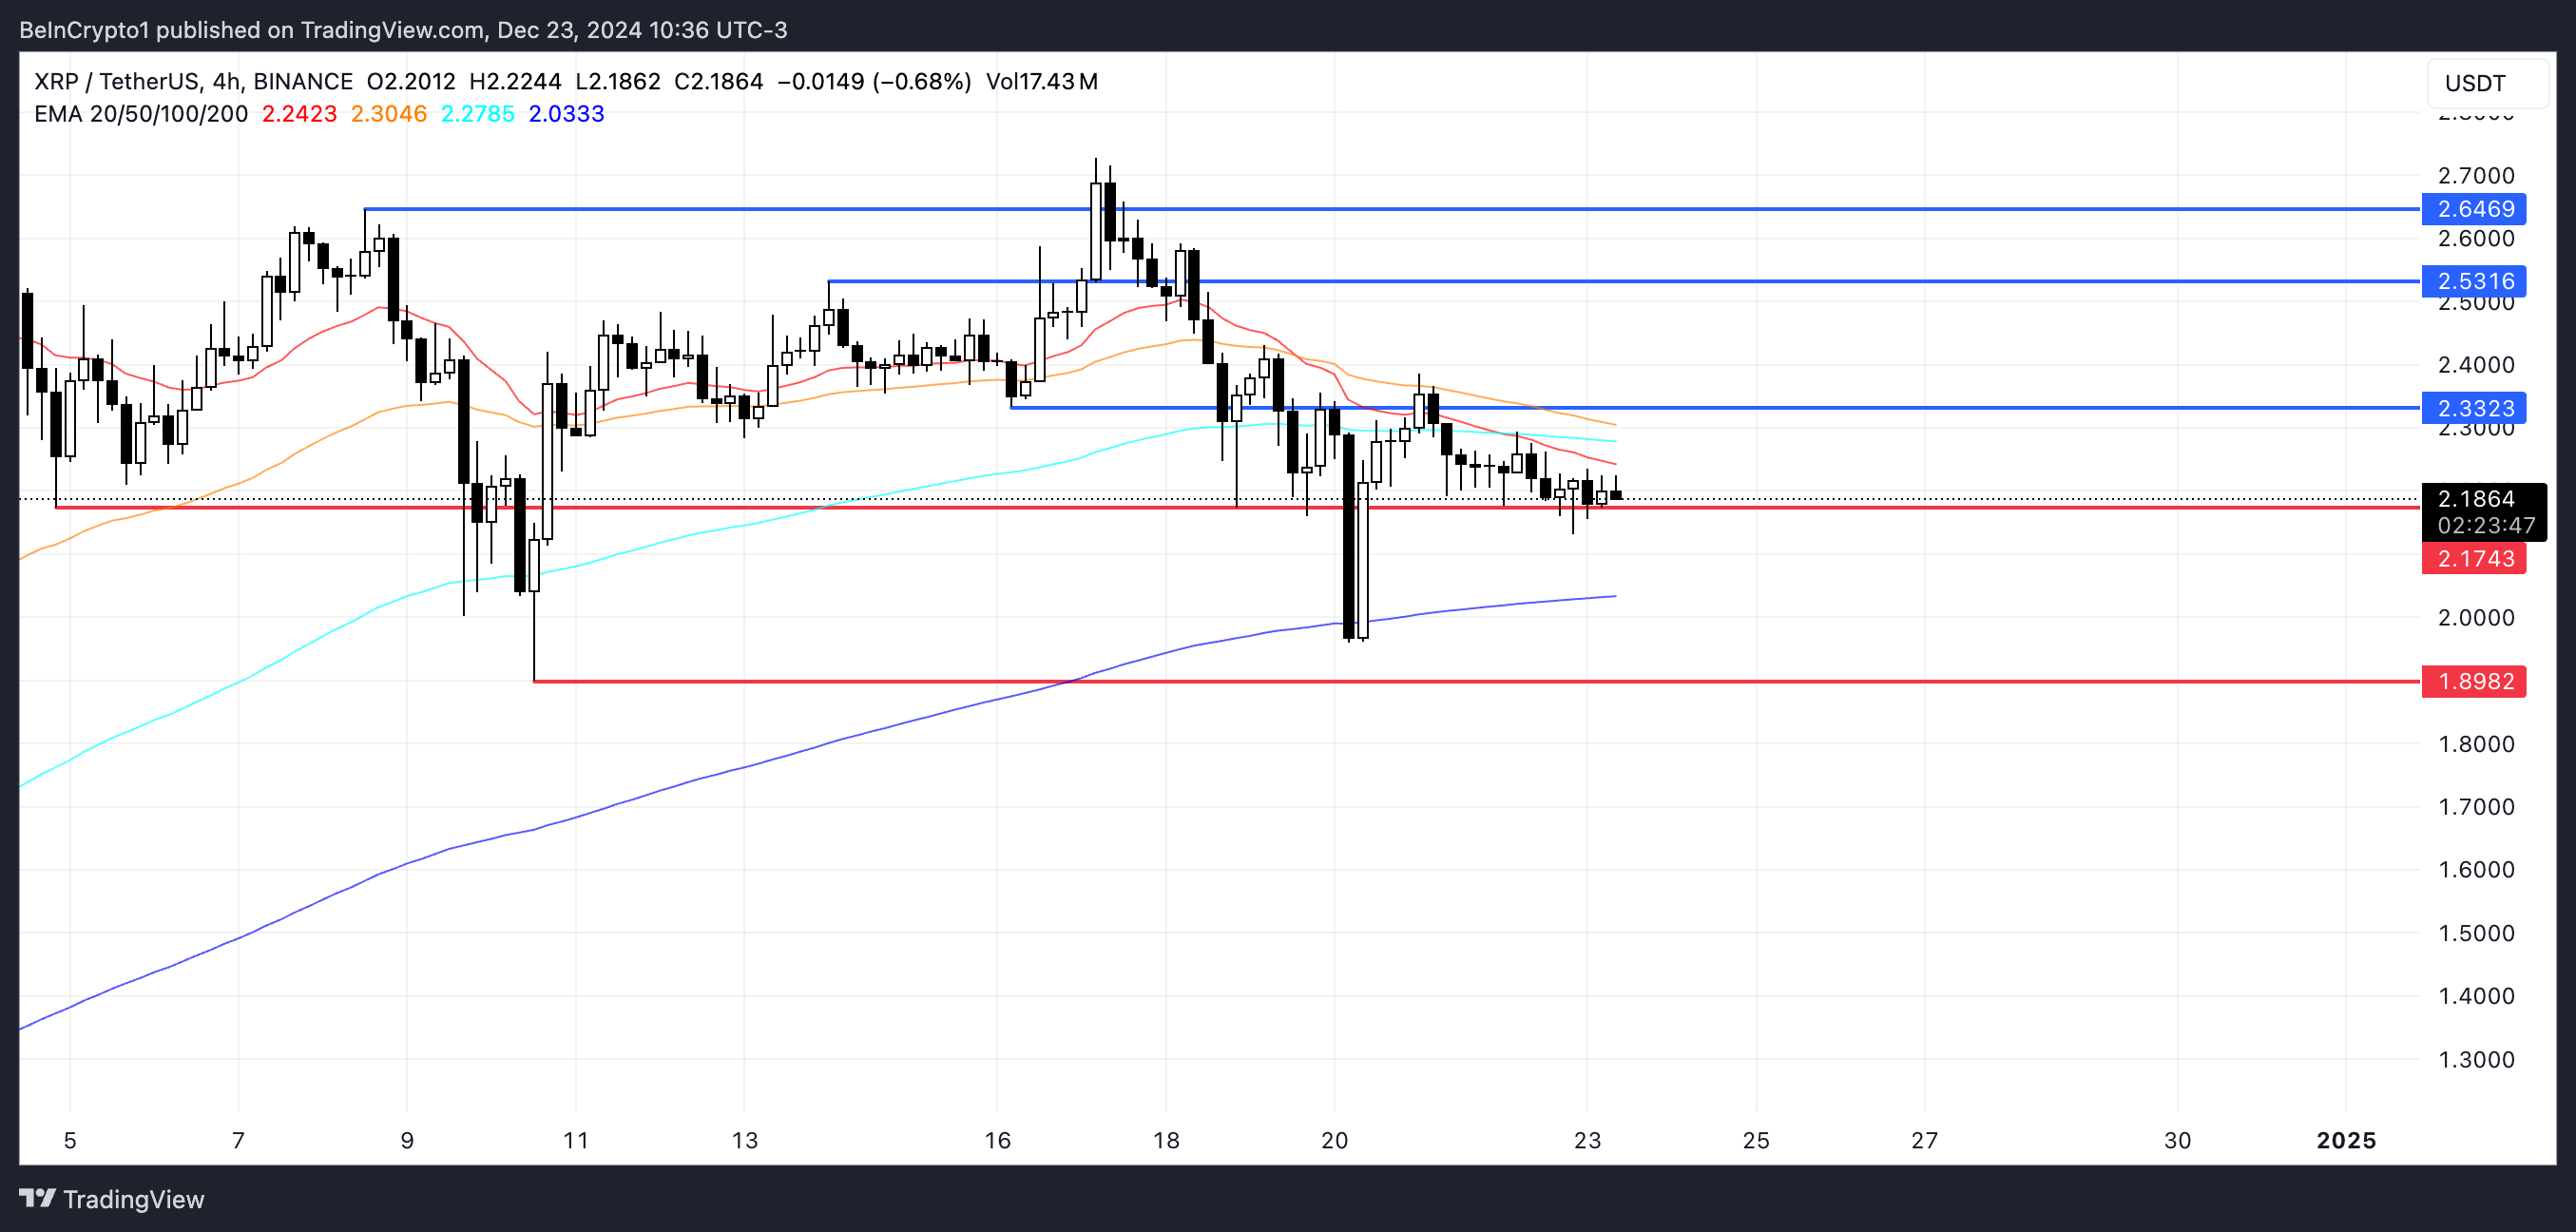
Conversely, if the XRP price can regain the uptrend it experienced in early December, when it rose to six-year highs, the outlook could become much more optimistic.
A rebound in growth momentum could see XRP first test the $2.33 level, a near resistance level. If the uptrend strengthens, additional targets at $2.53 and $2.66 could emerge.
General Bitcoin News
[ad_2]
More From Market

Strait of Hormuz Shipping Attack Raises Oil Supply Fears
An attack on Strait of Hormuz shipping has renewed fears for oil supplies, according to unconfirmed reports, though the specific incident behind the headline re...

Block EPS Jumps 65%, Stock Falls Despite Strong Earnings
Block reported a 65% surge in earnings per share, yet its stock fell in the wake of the results, a disconnect that made market sentiment, rather than the headli...

BTC Price Warning: 4 Reasons Bitcoin Could Drop Next Week
This BTC price warning centers on a single decision level: Bitcoin has struggled to maintain the $65,000 mark, and a four-part downside setup has traders watchi...

Crypto Price Analysis July 24: ETH, XRP, ADA, BNB, HYPE
Ethereum is the only asset in this group with a defined weekly move, up 3% but pressing into resistance, according to CryptoPotato’s July 24 price analysis . Th...

FT report: London Stock Exchange plans round-the-clock trading
The London Stock Exchange is looking at moving to round-the-clock trading, the Financial Times reported . In practice, that would mean shares could be bought an...

Bitcoin Price Analysis: BTC Bearish Below Key Reclaim
Bitcoin’s market structure remains bearish, with BTC unable to reclaim a key resistance level that would shift momentum back in favor of bulls. Until that level...

Author
Kishu Inu
Kishu Inu reports on crypto market activity, Web3 project updates, and blockchain business developments for CoinLive.