


Cash flow of 2.25 billion USD leaving the exchange: Will Bitcoin set a new peak?
Bitcoin (BTC) has experienced a 5% drop over the past week. As of this writing, the leading coin is trading at $96,905, below the key price threshold of $100,00...
[ad_1]
Bitcoin (BTC) has experienced a 5% drop over the past week. As of this writing, the leading coin is trading at $96,905, below the key price threshold of $100,000.
Interestingly, the recent decline did not trigger a major sell-off. This shows that optimism remains strong, and market participants hope the price of the currency will soon return above the $100,000 level.
Bitcoin Reduces Sell-Off
According to data from CryptoQuant, net BTC outflows from crypto exchanges over the past week exceeded $2.5 billion. Net outflow from the exchange tracks the amount of coins or tokens withdrawn from exchange wallets.
As exchange outflows spike, it points to a shift toward holding assets in personal wallets rather than trading or selling. This often indicates an optimistic sentiment, as investors may expect prices to rise.
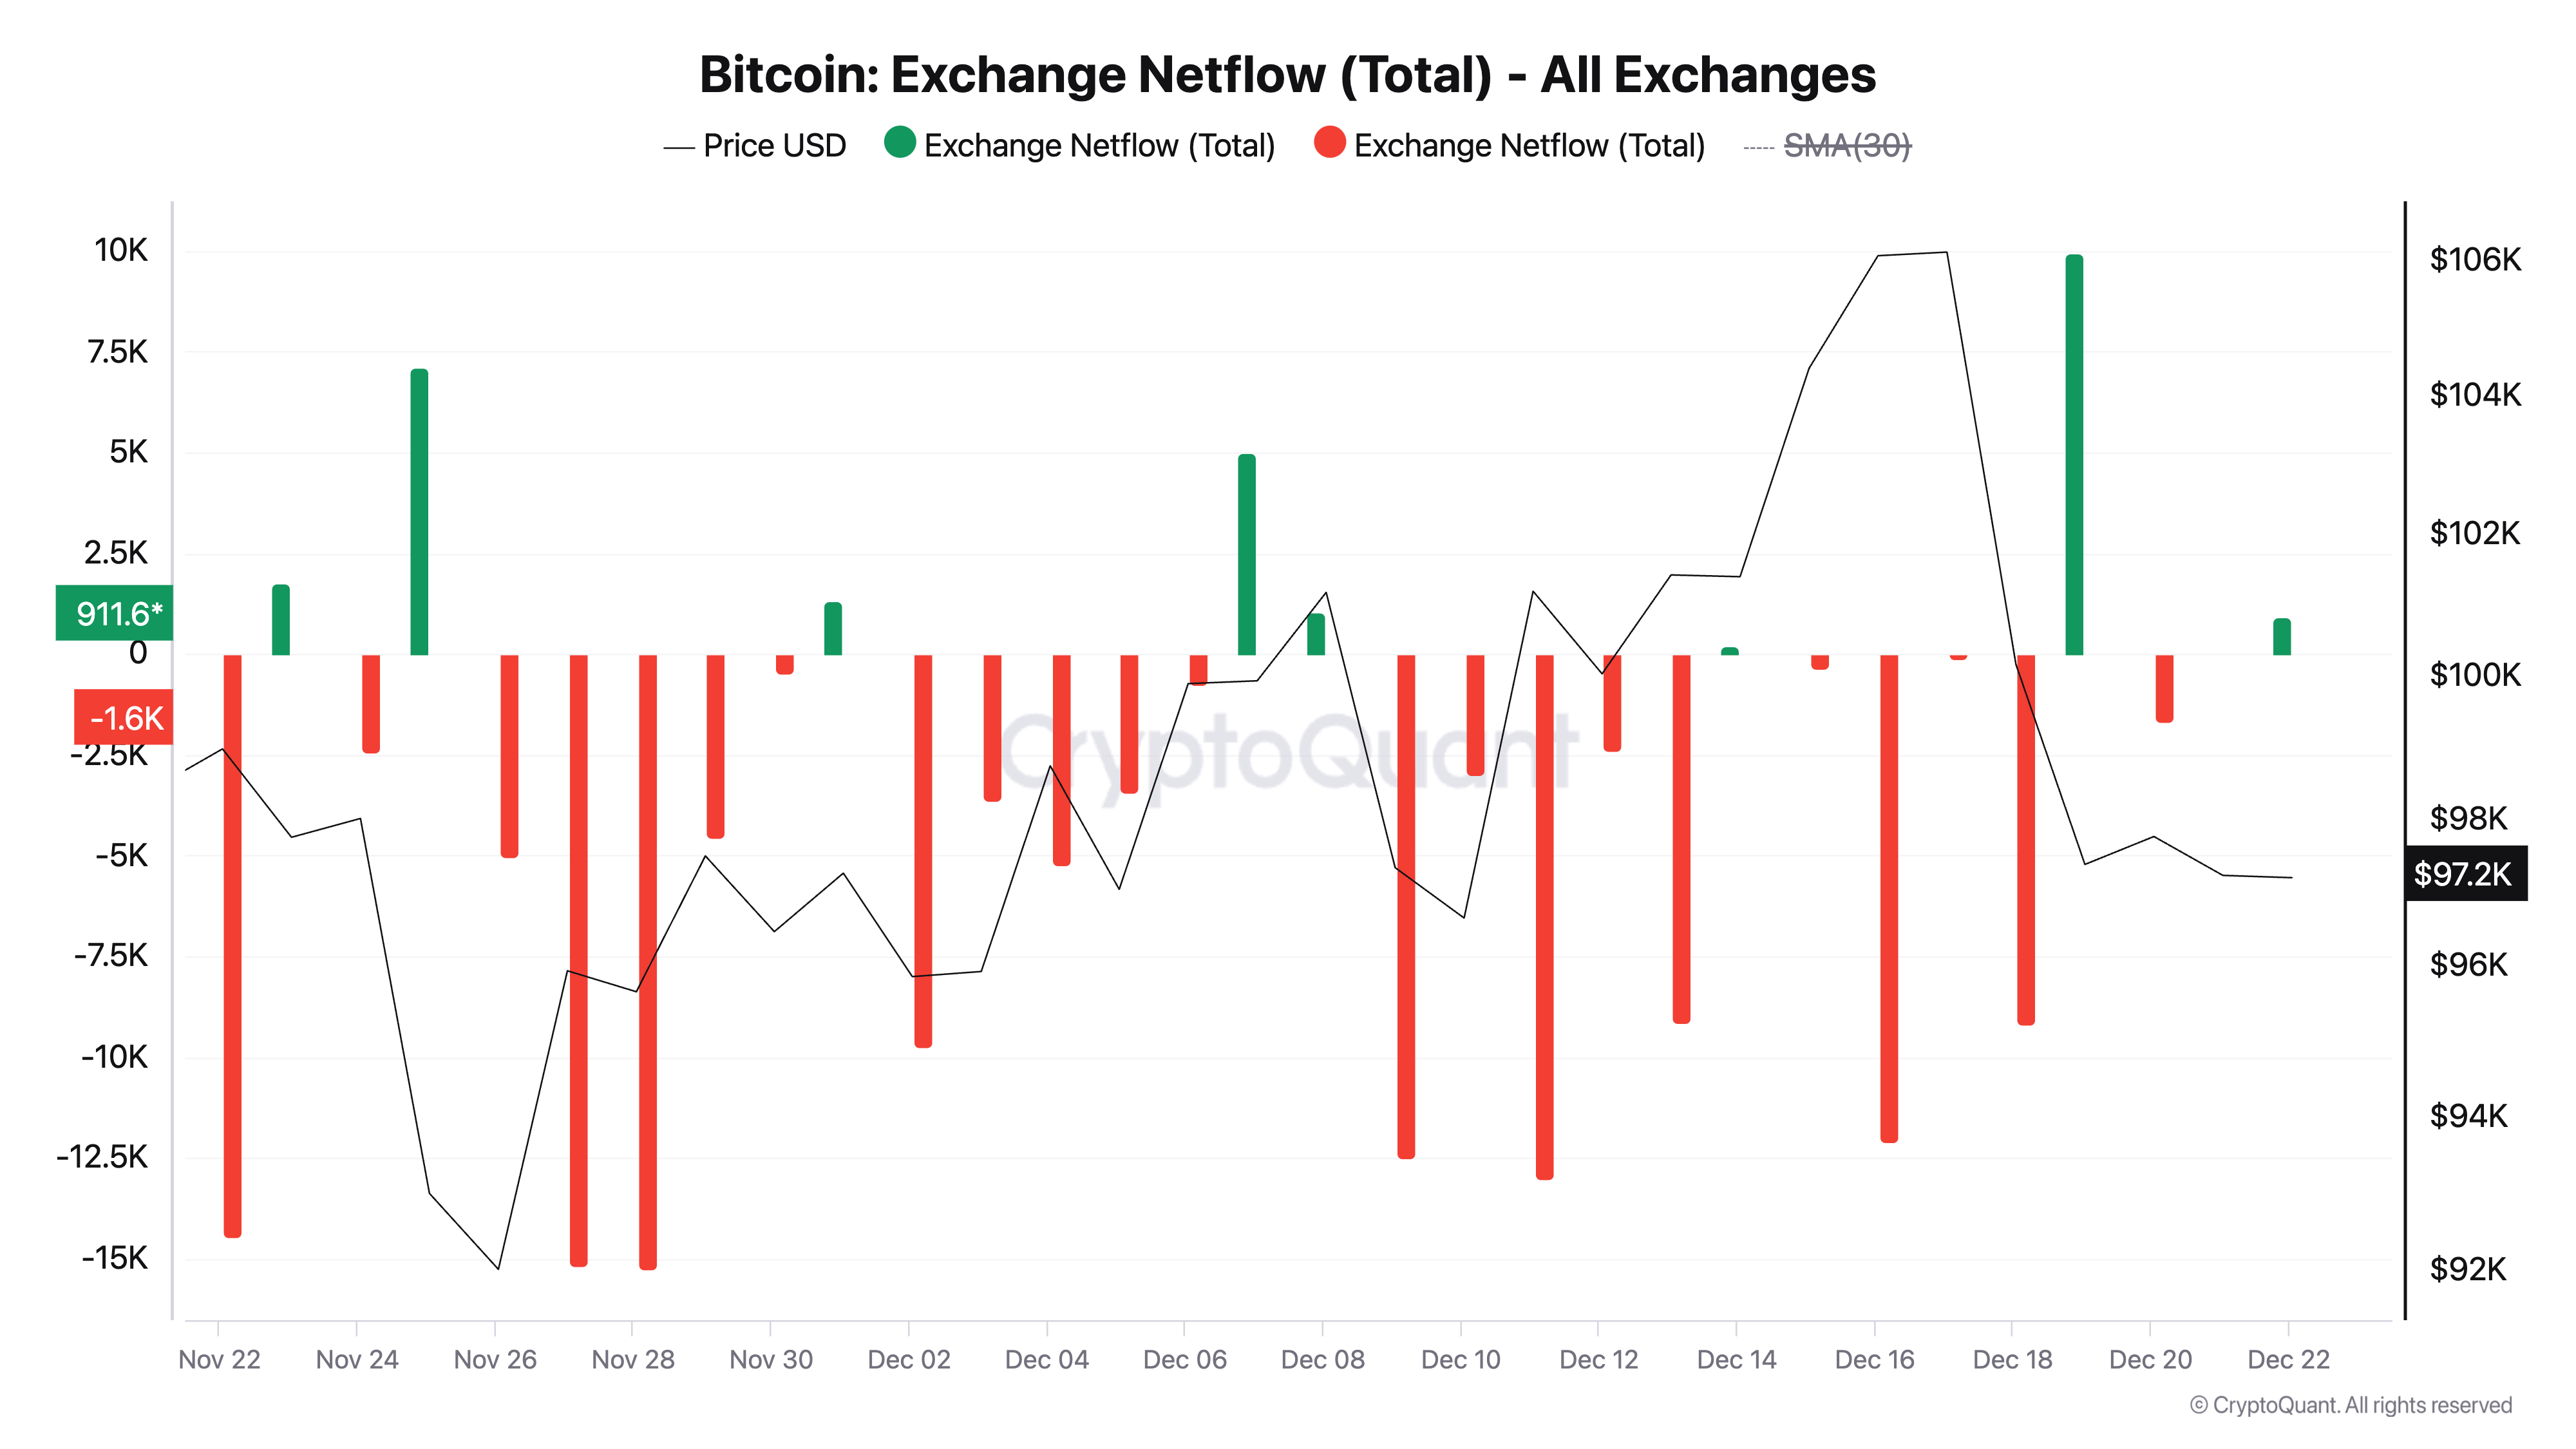
Commenting on what it means for Bitcoin, anonymous CryptoQuant analyst KriptoBaykusV2 noted in a report recently:
“If the Bitcoin outflow trend continues, this could reduce selling pressure in the market. With less Bitcoin available on exchanges and demand flat or increasing, prices could trend upward.”
Additionally, the coin’s positive funding rate is favoring the possibility of an uptrend in the near term. Currently, the funding rate in the perpetual futures markets is at 0.0081.
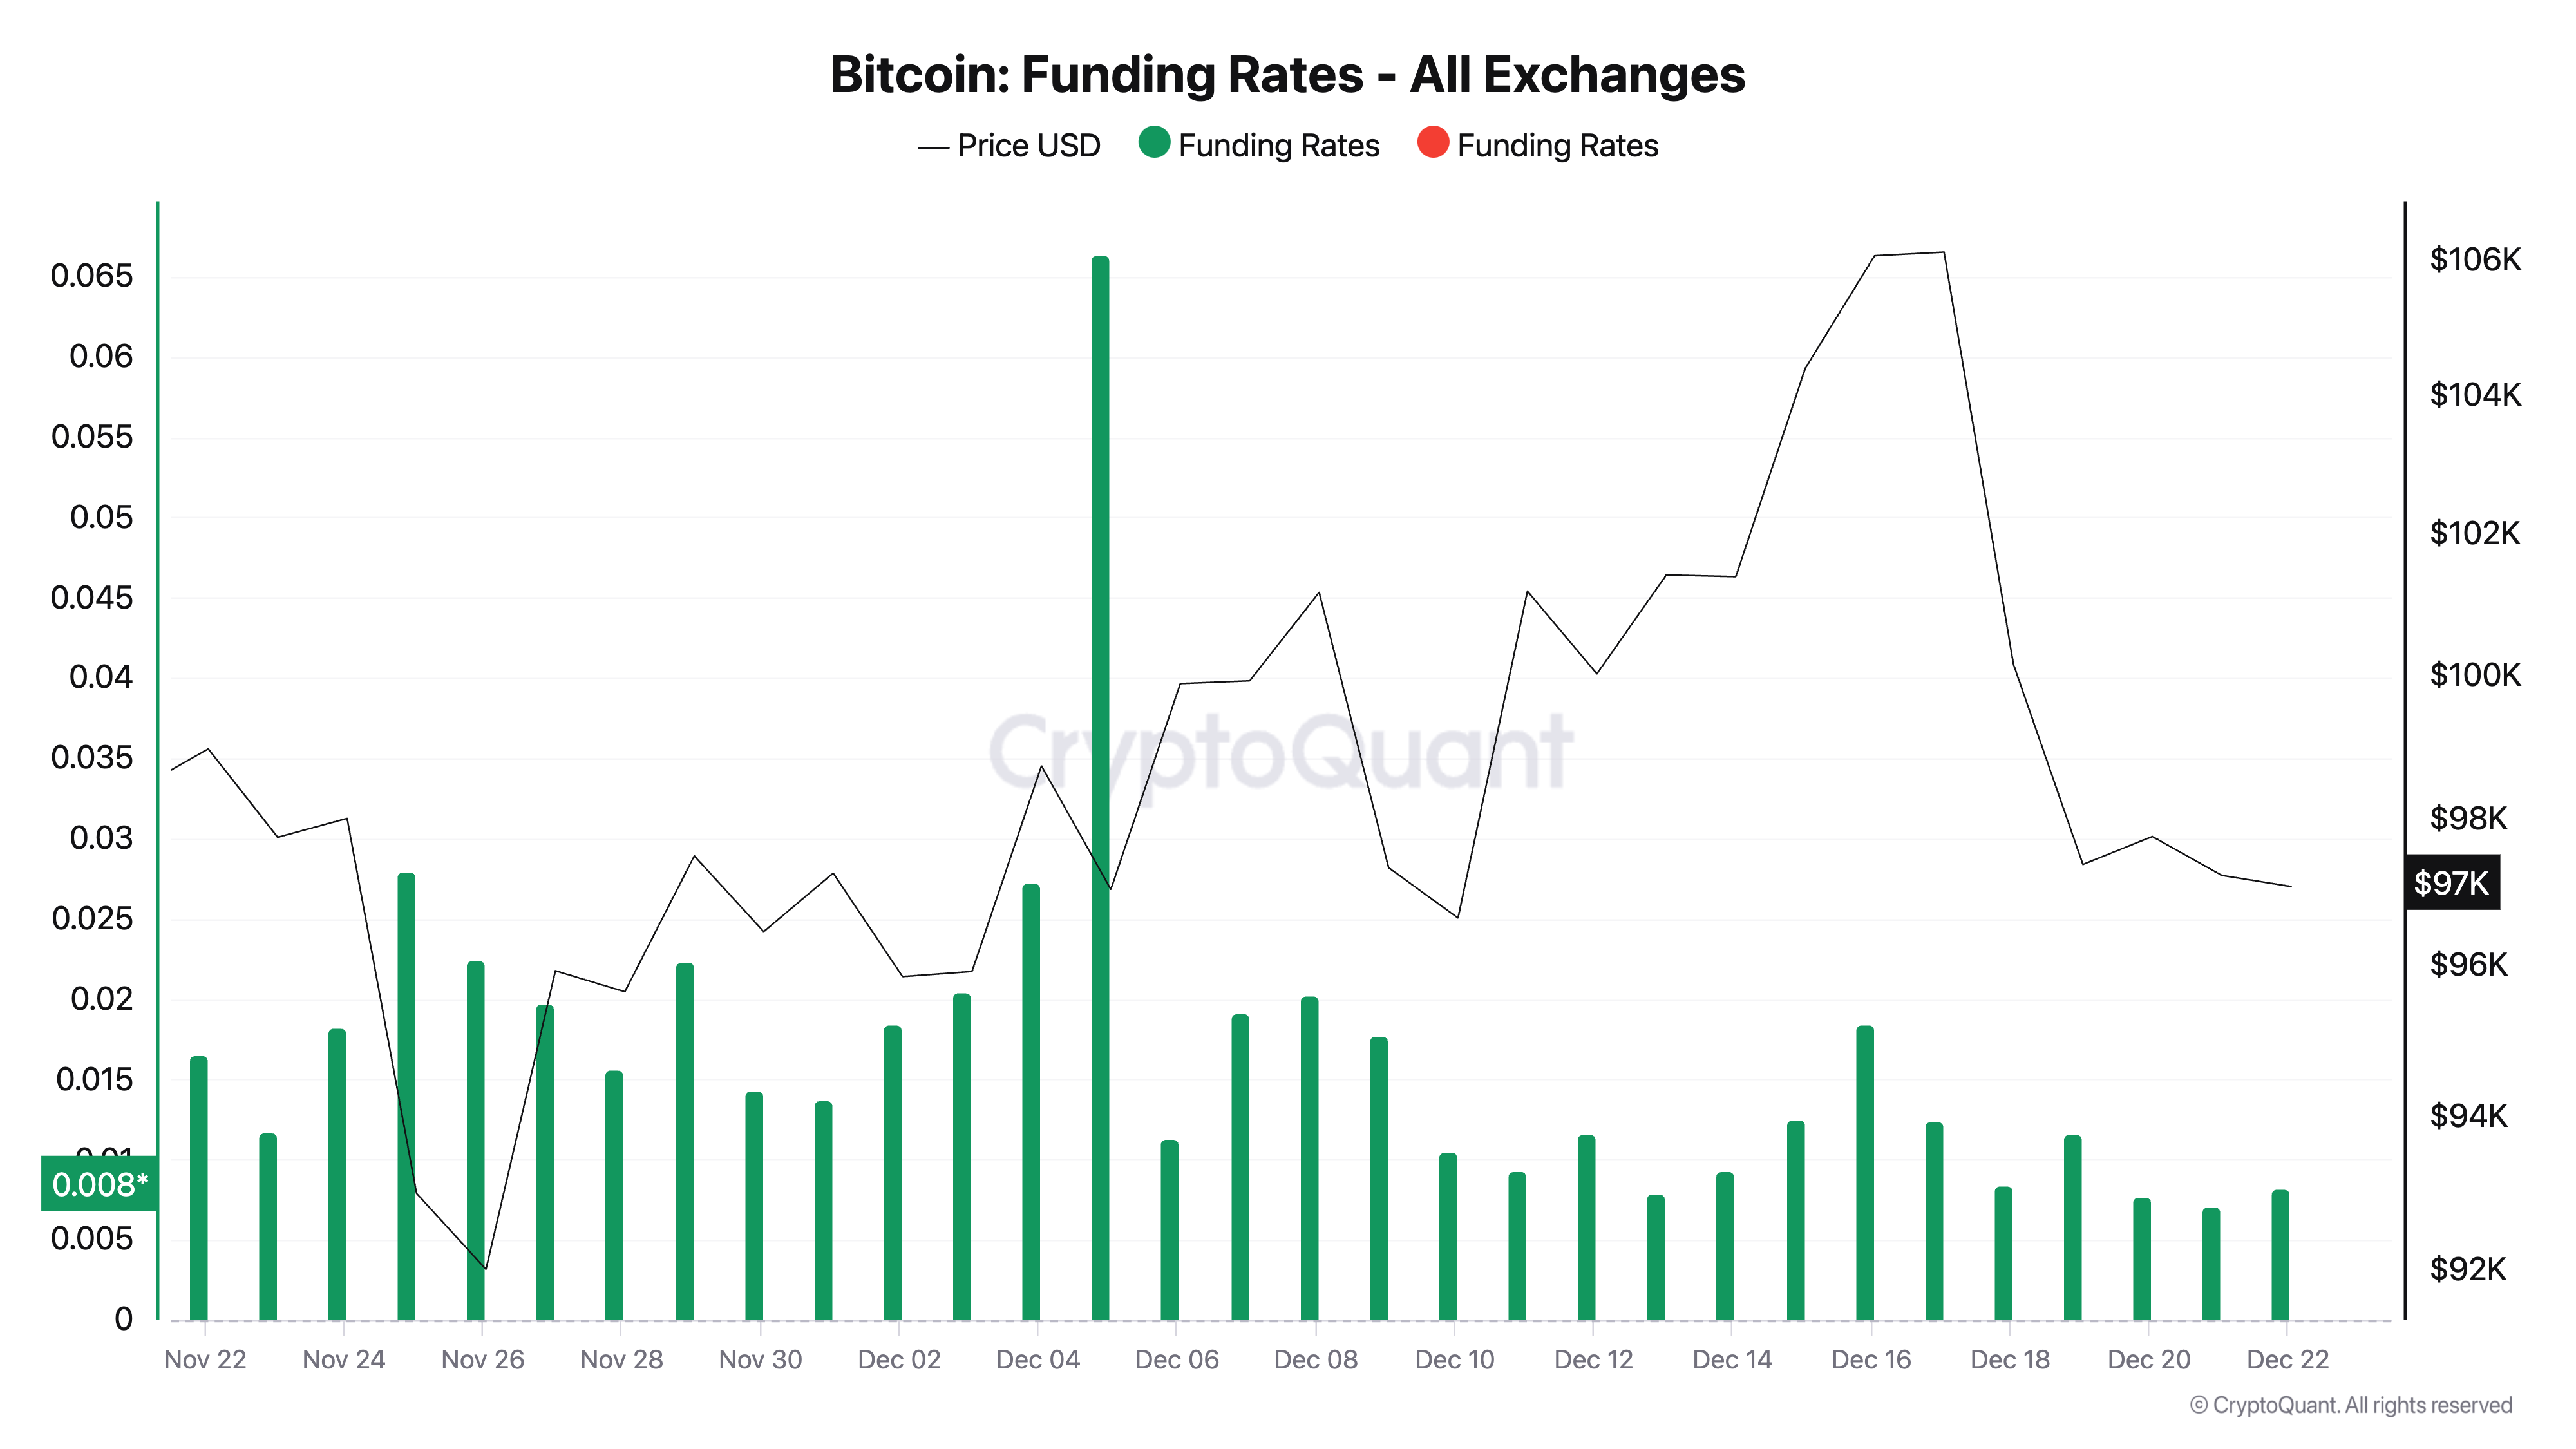
When an asset’s funding rate is positive, it means long positions are paying short positions. This indicates that market sentiment is bullish, with traders expecting prices to rise.
Bitcoin Price Prediction: Coin Faces Dynamic Resistance at $100,000
The market-wide price drop has caused BTC price to fall below the Ichimoku Cloud, forming a dynamic resistance at $100,160. This indicator tracks the dynamics of an asset’s market trend and identifies potential support/resistance levels.
When the price of an asset trades below the Leading Span A zone of the Ichimoku Cloud, this indicates a downtrend where selling pressure is strong and buyers are having difficulty pushing prices higher. This scenario usually signals the potential for further declines unless the price breaks back above the clouds.
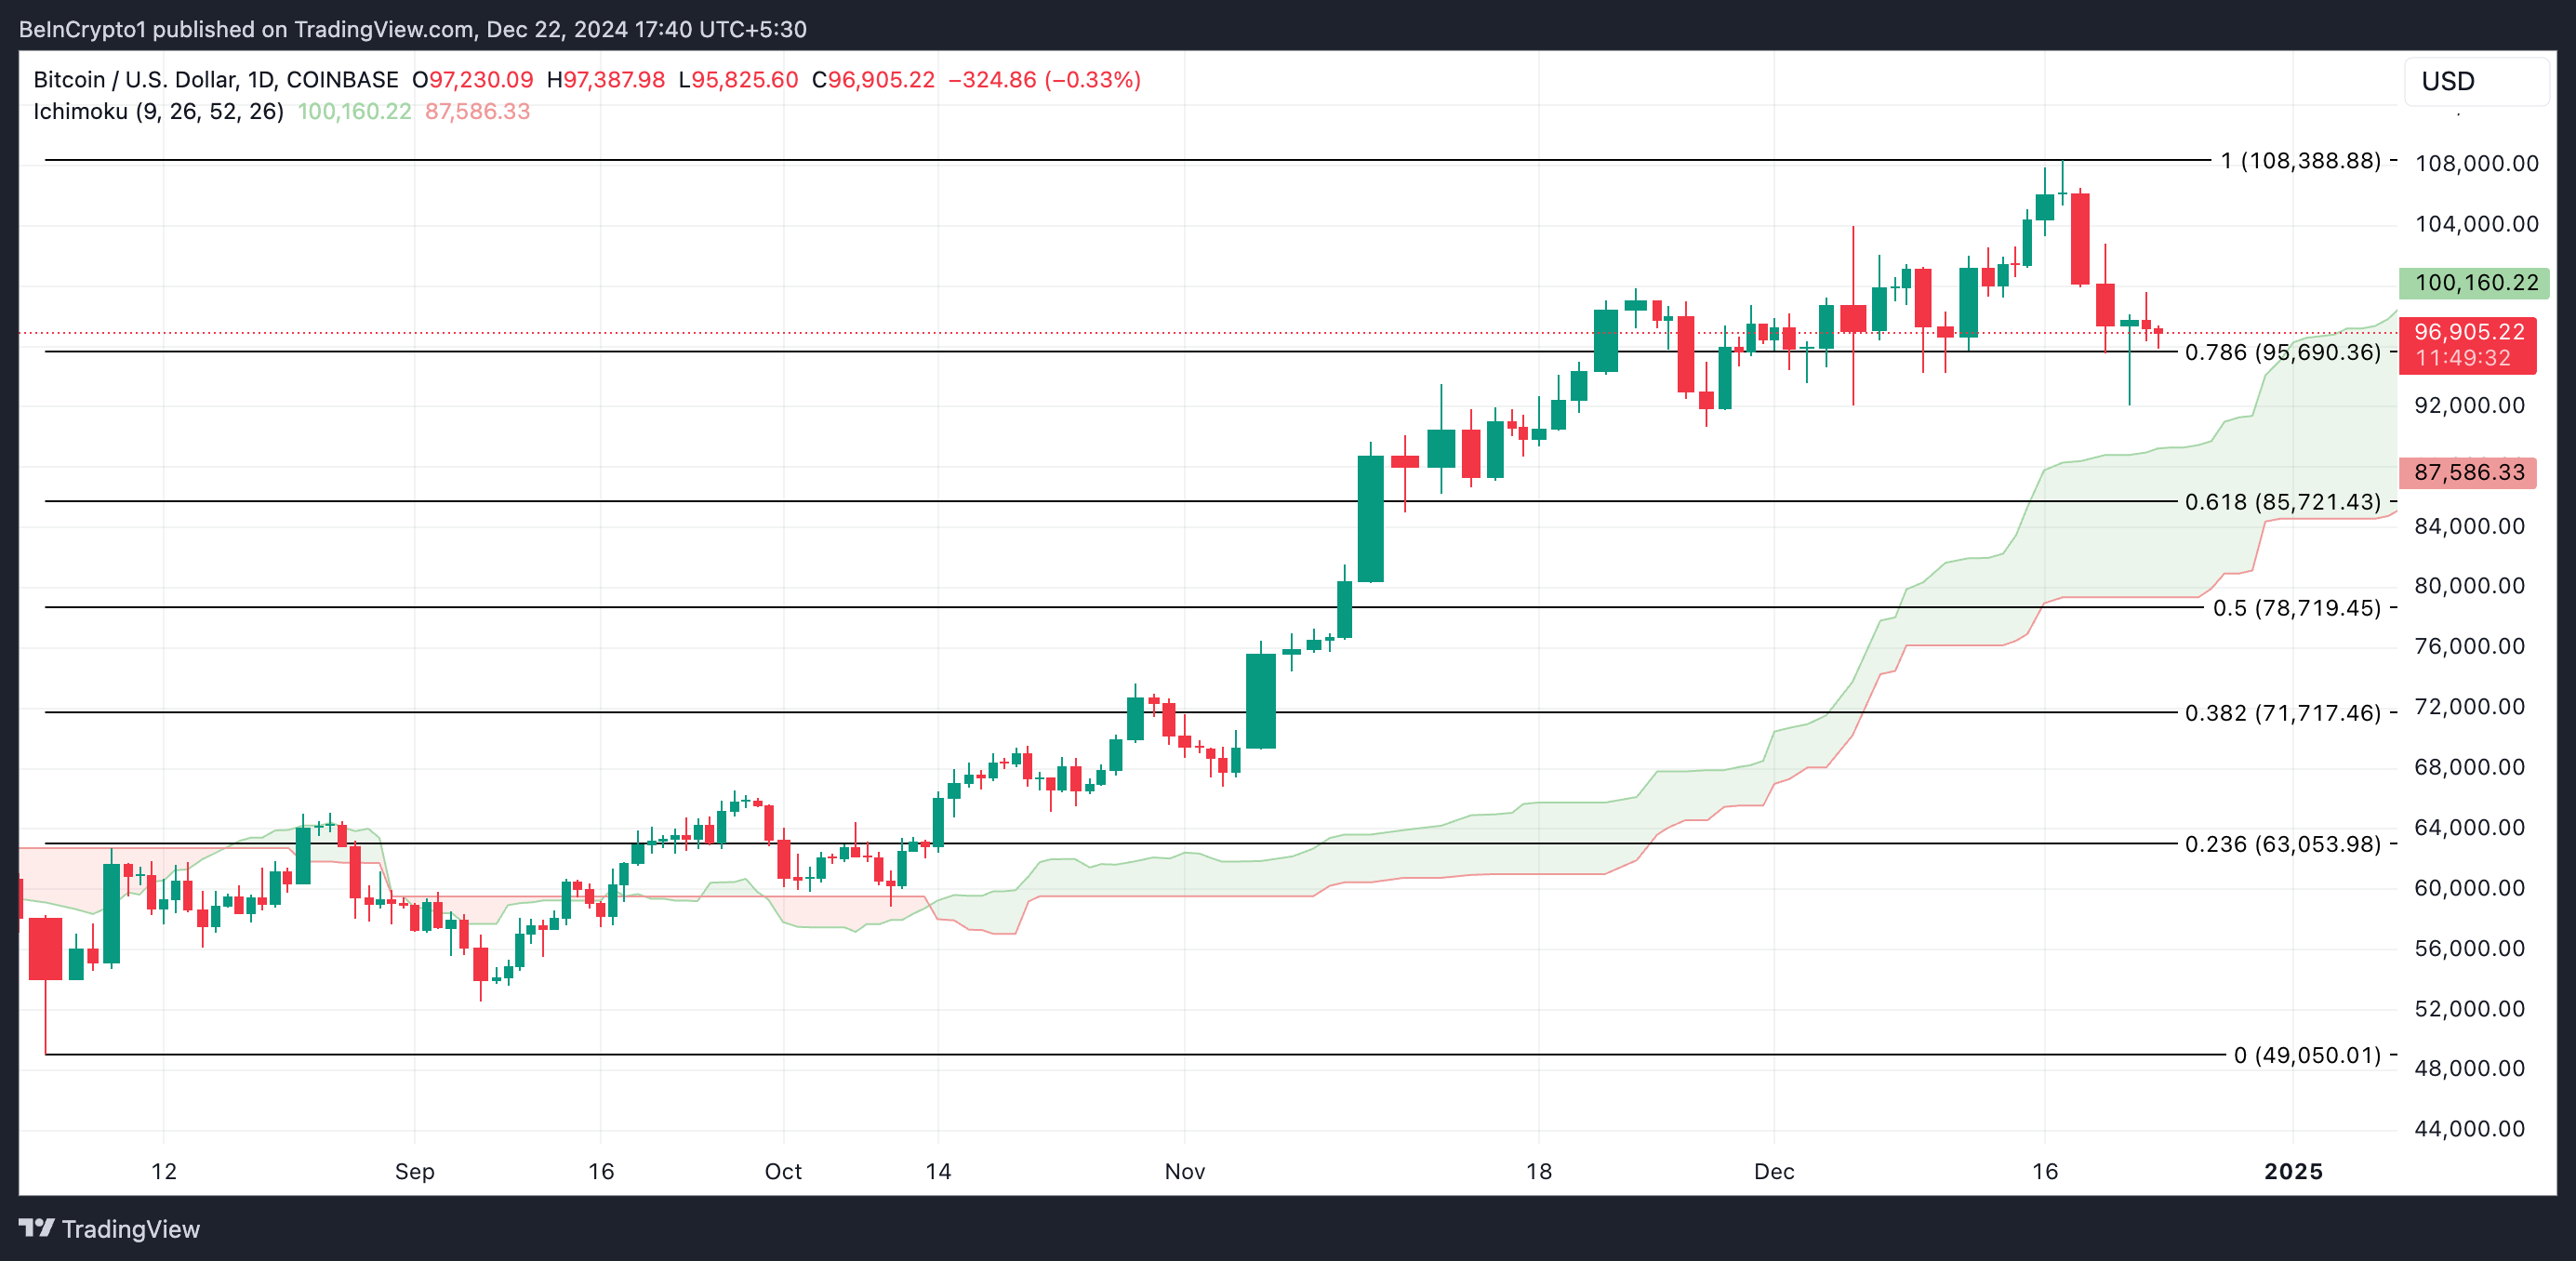
A successful break of this level for Bitcoin price would push it towards its all-time high of $108,388. Conversely, if it fails to break this resistance, Bitcoin price could drop to $95,690.
General Bitcoin News
[ad_2]
More From Market

Strait of Hormuz Shipping Attack Raises Oil Supply Fears
An attack on Strait of Hormuz shipping has renewed fears for oil supplies, according to unconfirmed reports, though the specific incident behind the headline re...

Block EPS Jumps 65%, Stock Falls Despite Strong Earnings
Block reported a 65% surge in earnings per share, yet its stock fell in the wake of the results, a disconnect that made market sentiment, rather than the headli...

BTC Price Warning: 4 Reasons Bitcoin Could Drop Next Week
This BTC price warning centers on a single decision level: Bitcoin has struggled to maintain the $65,000 mark, and a four-part downside setup has traders watchi...

Crypto Price Analysis July 24: ETH, XRP, ADA, BNB, HYPE
Ethereum is the only asset in this group with a defined weekly move, up 3% but pressing into resistance, according to CryptoPotato’s July 24 price analysis . Th...

FT report: London Stock Exchange plans round-the-clock trading
The London Stock Exchange is looking at moving to round-the-clock trading, the Financial Times reported . In practice, that would mean shares could be bought an...

Bitcoin Price Analysis: BTC Bearish Below Key Reclaim
Bitcoin’s market structure remains bearish, with BTC unable to reclaim a key resistance level that would shift momentum back in favor of bulls. Until that level...

Author
Kishu Inu
Kishu Inu reports on crypto market activity, Web3 project updates, and blockchain business developments for CoinLive.