


Crypto Liquidation Map: How to Read It, and Where the Levels Sat on 17–18 November 2026
NewsPlain-English guide to crypto liquidation maps with a dated 18 November 2026 snapshot for BTC, ETH and SOL, the 13 November long squeeze, and the limits of the...
What to know first
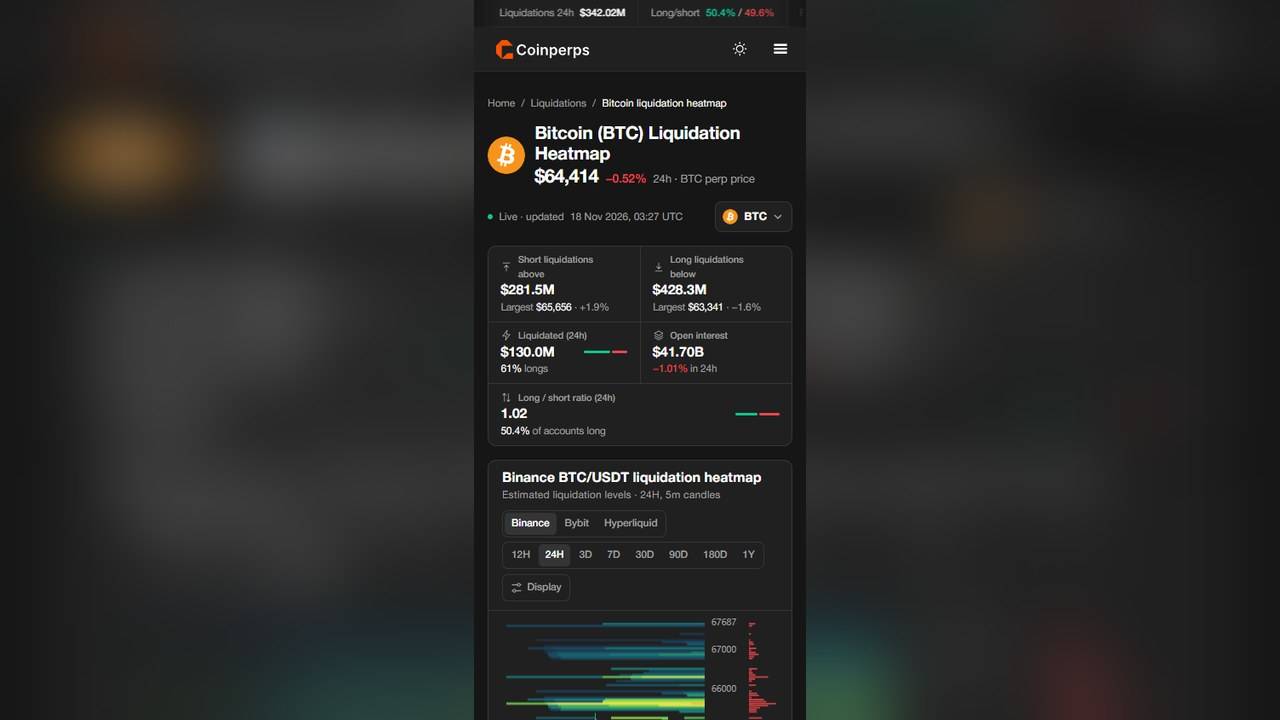
A liquidation map estimates how much leveraged trading would be force-closed if the price touched each level. On 18 November 2026, Coinperps showed Bitcoin at about $64,419 with roughly $428.3M of long positions that would be liquidated below the price and $281.5M of short positions above it. That is an estimate from one exchange (Binance), not a forecast. Different tools show different numbers, and a cluster of liquidations is context, not a signal to trade.
Our reading: the map is most useful as a picture of how crowded one side of the market is. It is least useful as a prediction of where price goes next.
How we chose what to cover
Before writing, we searched for the main keyword and two variants (how to read a map, and current heatmap or liquidations today). Titles and snippets only were read for those searches, not the full pages. The results split into two groups: explainers that teach the concept, and live trackers with daily snapshots. Readers seem to want both, so this guide gives the explanation first, then a dated snapshot, then the limits.
Terms used in this guide
| Term | Plain meaning |
|---|---|
| Liquidation | The exchange closes your trade automatically because your margin (the deposit backing it) is nearly used up |
| Long | A bet that the price will rise |
| Short | A bet that the price will fall |
| Leverage | Borrowing to hold a bigger position than your deposit, for example 10x |
| Perpetual future | A futures contract with no expiry date, the most common leveraged crypto product |
| Open interest | The total value of open leveraged positions |
| Cascade | Forced selling pushes the price down, which triggers more forced selling |
| Heatmap | A chart that colours price levels by how much estimated liquidation sits there |
How a liquidation map is built
Nobody publishes every trader's liquidation price. Map providers take open interest, assume a spread of leverage levels (for example 10x, 25x, 50x), and work out where those positions would be closed. So the map is a model. Two providers with different assumptions will draw different pictures.
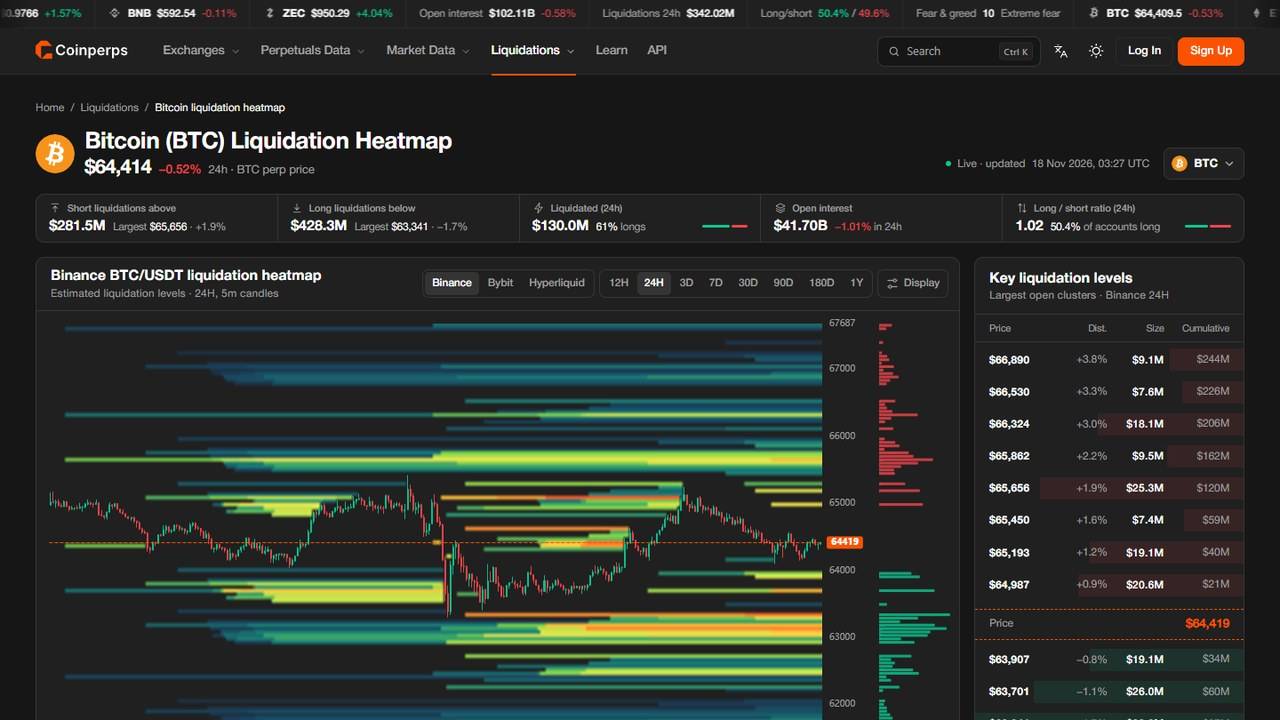
Coinperps BTC heatmap, desktop, 18 November 2026. Bright bands are larger estimated clusters. The right panel lists the largest ones with distance from the current price.
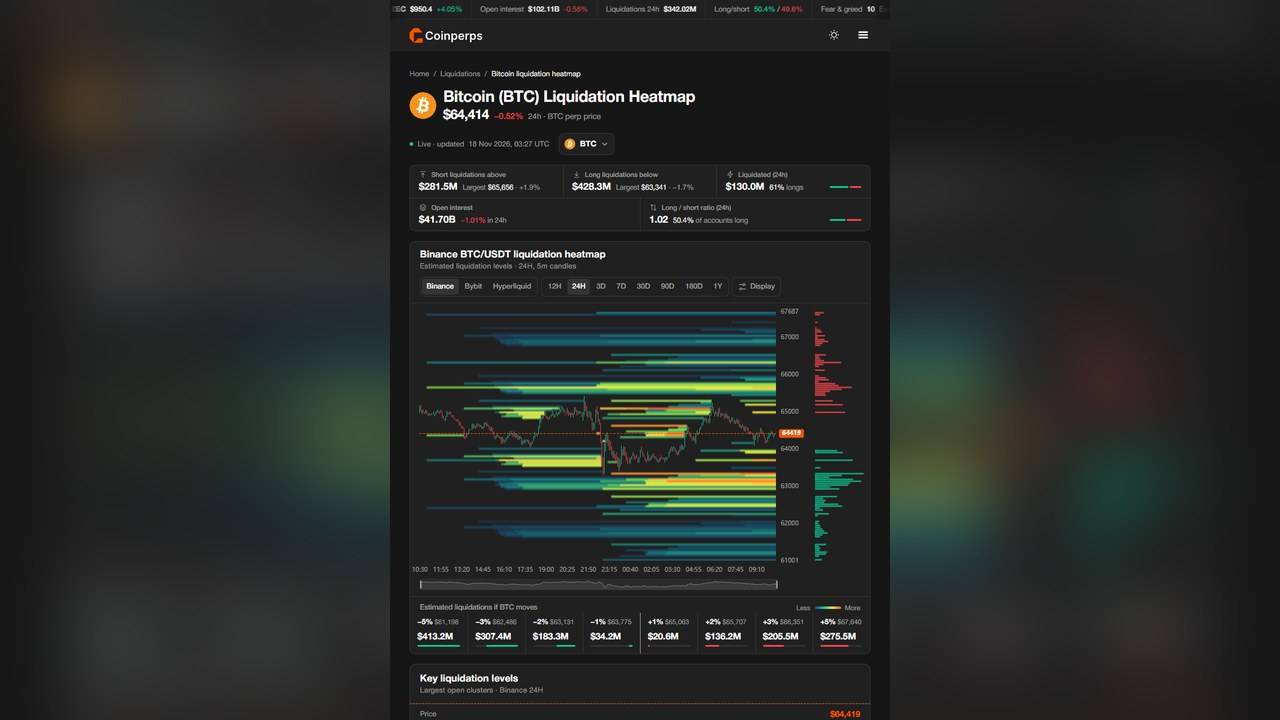
Tablet and mobile views keep the key numbers (short liquidations above, long liquidations below) at the top, which is handy for a quick check.
The four-step cascade, simply
- Many traders open leveraged longs at similar prices.
- Price slips to the level where the first of them runs out of margin.
- The exchange sells their positions at market, which pushes the price lower.
- That lower price reaches the next group of longs, and the cycle repeats until the cluster is used up.
Shorts work the same way in reverse: a rise forces shorts to buy back, which pushes the price higher.
Dated snapshot: BTC, ETH, SOL
| Asset | Date | Price | Shorts above | Longs below | Largest short cluster | Largest long cluster | Source |
|---|---|---|---|---|---|---|---|
| BTC | 18 Nov | $64,419 | $281.5M | $428.3M | $65,656 ($25.3M) | $63,341 ($33.3M) | Coinperps |
| ETH | 17 Nov | $1,789 | $357.1M | $160.2M | $1,839 ($34.1M) | $1,769 ($32.6M) | Coinperps ETH page |
| SOL | 18 Nov | $74.84 | $15.9M | $32.8M | not recorded | $70.73 ($3.1M) | Coinperps SOL page |
All figures are Binance 24-hour estimates from Coinperps and were read on the dates shown. A second source, Hunter Killer, published a BTC snapshot on 17 November (11:33 UTC, reference price $64,549, delayed two hours). It lists its heaviest long cluster at $63,436 (about $196.6M, 1.7% below) and short clusters between $64,598 and $65,082 of roughly $148M to $151M each. It labels this "descriptive positioning context, not a forecast".
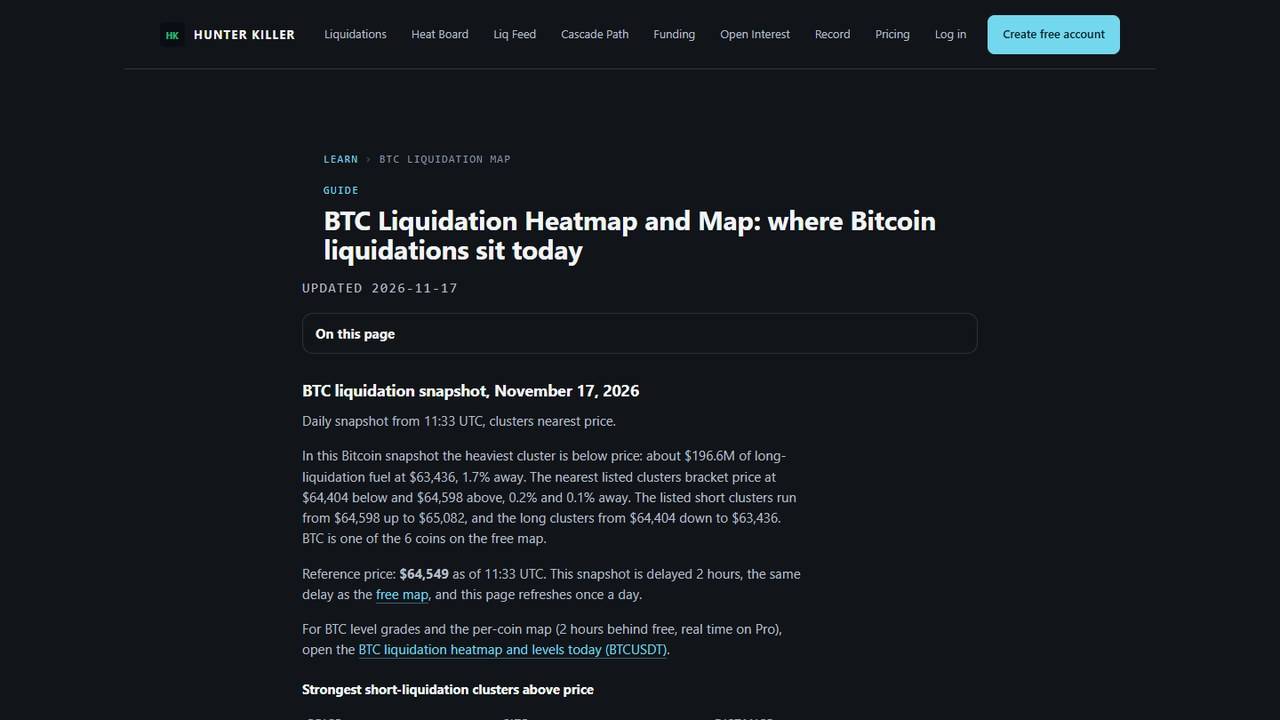
Notice the two tools do not agree on sizes. Coinperps counts Binance only in the view above; Hunter Killer uses its own method. Blockmetric covers Hyperliquid only, so its numbers differ again. This is why you should never quote one map as "the" market.
Our reading of the numbers
- BTC has more fuel below than above. $428.3M of longs sit below the price versus $281.5M of shorts above. A 5% fall to about $61,198 would run through roughly $413M of longs, while a 5% rise to about $67,640 would hit around $275M of shorts. Downside has the larger pool of forced selling.
- ETH is the opposite. $357.1M of shorts sit above and only $160.2M of longs below. If Ether bounces, more forced buying is waiting than forced selling on a dip.
- Context matters. Over the last three months Coinperps counts $10.85B of BTC liquidations, 60% longs, an average of about $120.5M a day. The largest day was 22 August at $887.3M. A $428M pool is large against a normal day, but not extreme against the biggest days.
Case study: the 13 November long squeeze
On 13 November, Coin Insider reported BTC falling about 6.8% in 24 hours to roughly $68,610. Coin Insider cited CoinGlass data showing $1.47B liquidated in 24 hours, of which $1.31B (about 89%) were longs, and 54% of the total (about $798M) came within four hours. Coin Insider also reported that an analyst at Laevitas called it a leverage event. Price broke through $72,000 and then $70,000, forcing out longs clustered below.
Two things to take from it. First, the figures measure position size closed, not trader losses. Second, Coin Insider reported ETF outflows and rate worries among the macro triggers. Liquidations may have amplified a move already underway.
How to use a liquidation map
- Check the date and the exchange the map covers.
- Compare long and short totals to see which side is crowded.
- Look at the distance, not just the size. A big cluster 10% away matters less than a medium one 1% away.
- Use two tools and note where they disagree.
- Treat it as risk context for position size and stop placement, not an entry signal.
Limits
- Maps are estimates built on assumed leverage, not real account data.
- Clusters can be removed when traders close or add margin before price arrives.
- Price does not have to go to a cluster. Many clusters are never touched.
- Different tools, exchanges and time windows give different totals.
What we did not check
- We did not use paid or proprietary Coinglass data.
- We did not backtest how often price reaches the largest clusters.
- Blockmetric covers Hyperliquid only, so we did not mix it into the totals.
FAQ
What is a liquidation map in crypto?
A chart estimating how many leveraged positions would be force-closed at each price level, based on open interest and assumed leverage.
Is a liquidation heatmap accurate?
It is an estimate. Providers do not see every account, so different tools show different sizes. Use it as a rough guide.
Does price always move to the biggest cluster?
No. Clusters can attract price, but they can also be ignored or disappear before price arrives.
What is a long squeeze?
A fall in price that forces leveraged longs to be sold, pushing the price down further. The 13 November move is a recent example.
Where can I see liquidations for free?
Coinperps and Hunter Killer both publish free views, with some features delayed or limited to paid plans.
This article is for information only and is not financial advice. Leveraged trading can lose more than you expect. Publication and update times, including timezone, are not stated. Data was read on 17 and 18 November 2026 and will have changed.
Editorial credits
Checked by CoinLive QC Team before publishing on November 19, 2026 for headline accuracy, original value, factual consistency and authorship claims: our AI review system checks every article before it goes live, and our duty editor monitors it after publication. Report an error.
CoinLive uses AI for research, drafting and review. Our editorial team is responsible for every article and corrects or withdraws articles when needed. How we review.
More From Price Action


Author
Akita Inu
Akita Inu covers fast-moving crypto market updates, exchange news, and token ecosystem developments for CoinLive, with a focus on concise source-led reporting.