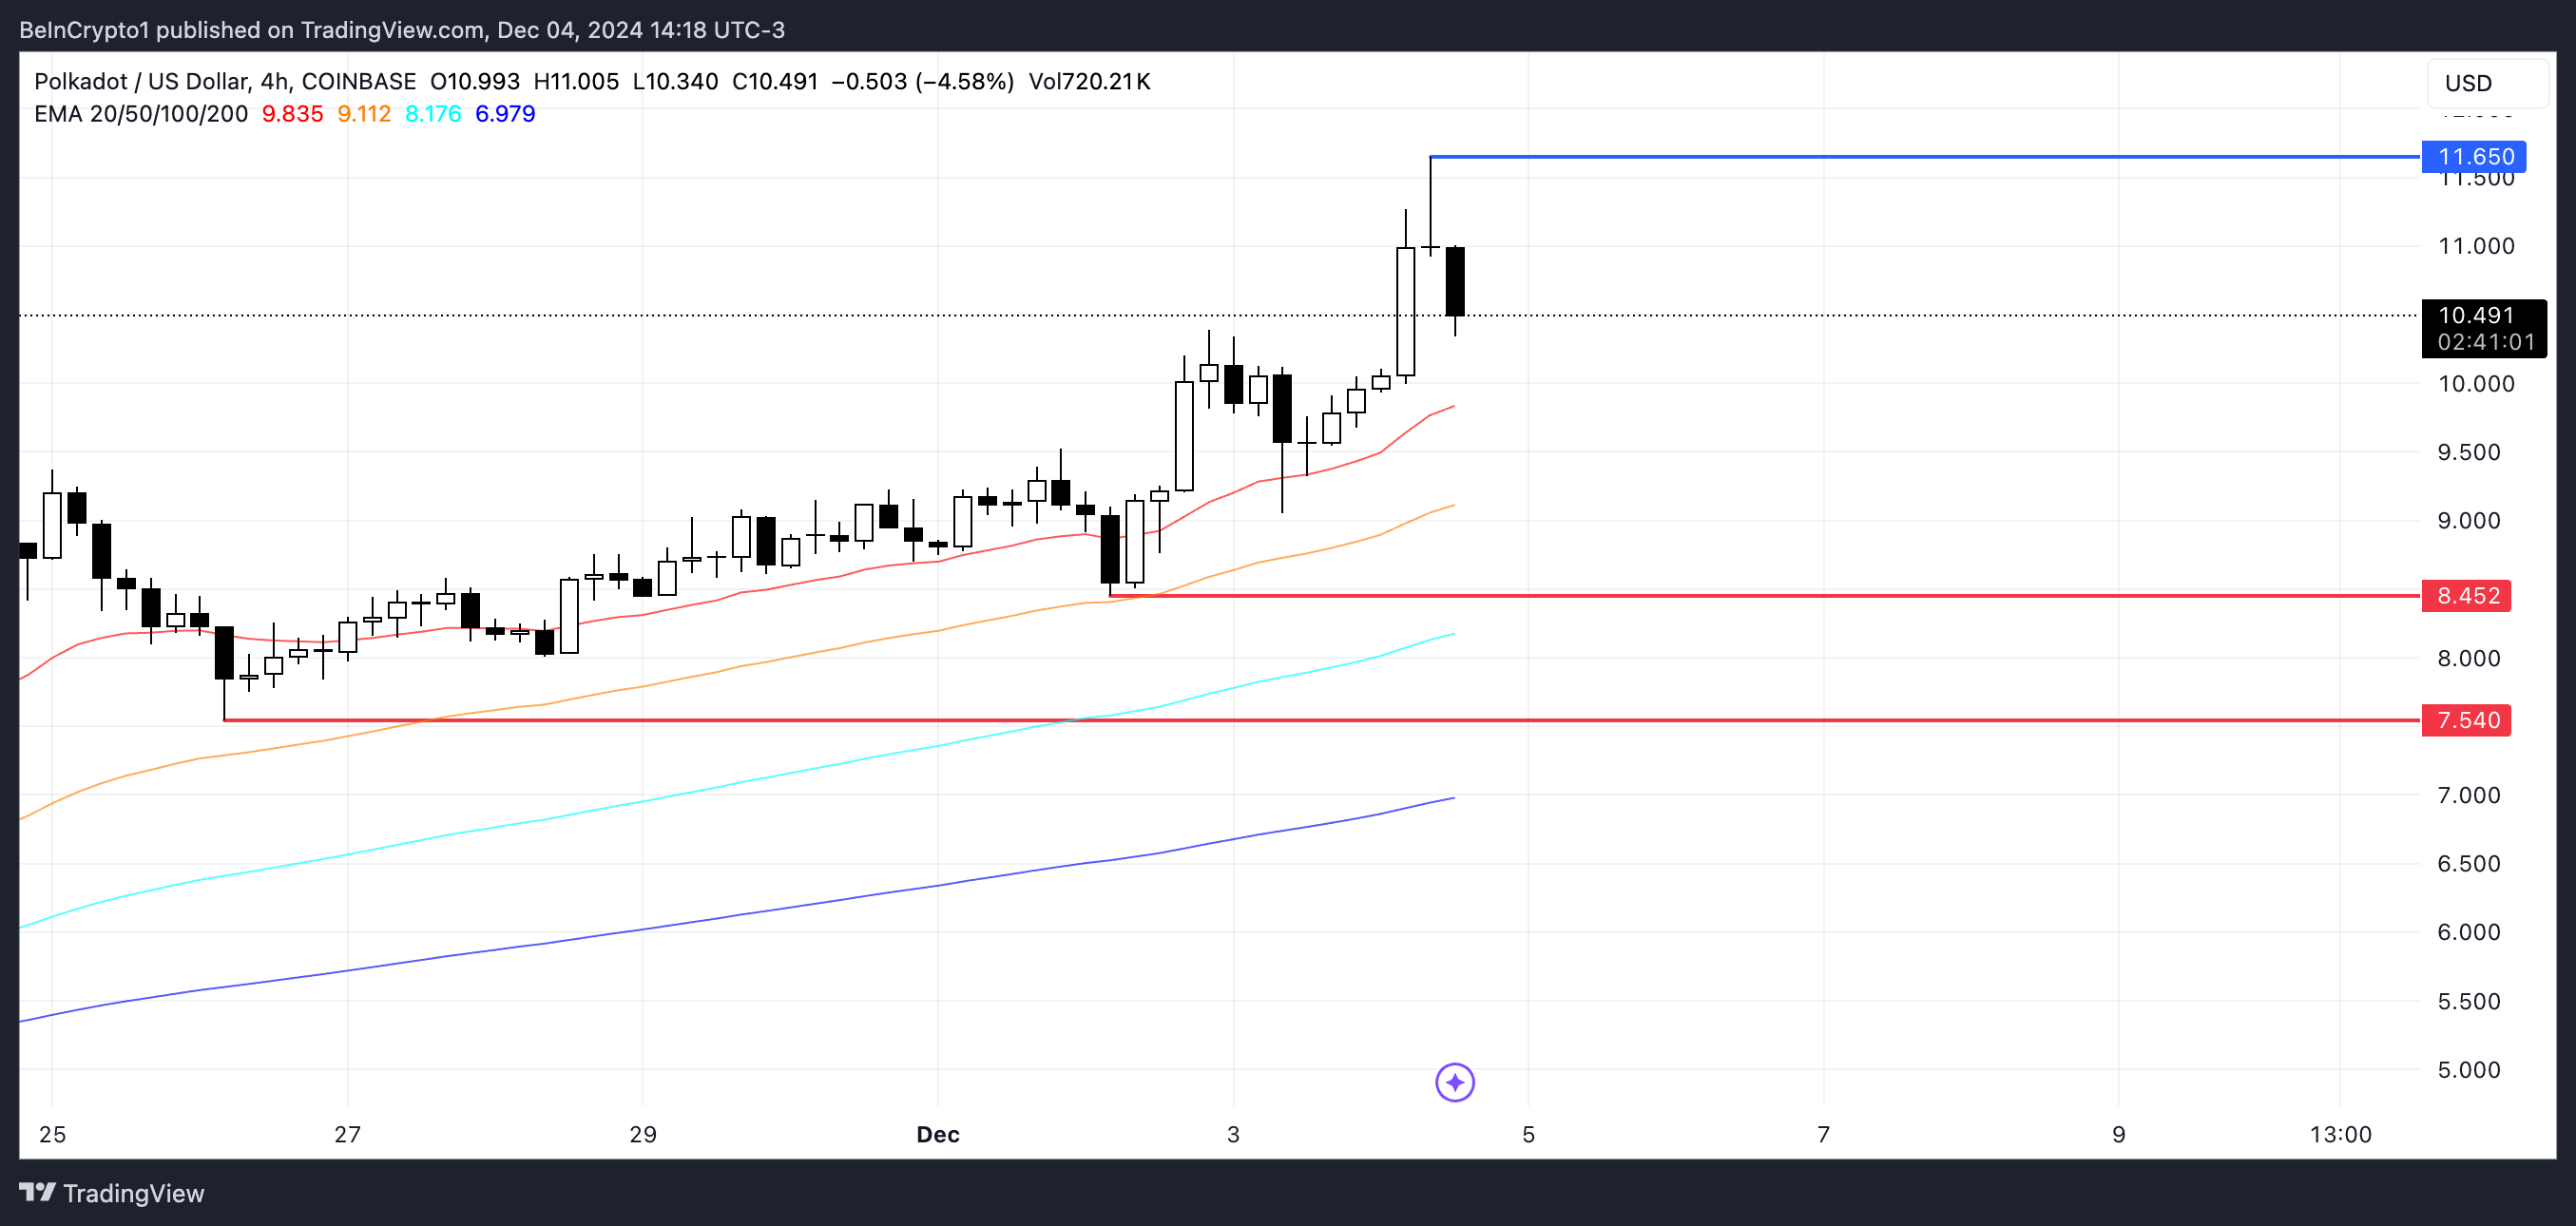
Polkadot (DOT) price has increased more than 10% in the past 24 hours and increased 178.44% in the last 30 days. This is a clear sign of strong price momentum. However, technical indicators suggest this rally may be losing momentum, with RSI and CMF both showing signs of abating buying pressure.
While DOT’s EMAs remain bullish, a wave of weakness could push the price to test support levels. Conversely, if bullish momentum resumes, DOT could move towards the next resistance level, with a breakout possible at its highest level since April 2022.
DOT RSI Has Cooled Down
Currently, DOT RSI is at 62, cooling off after breaking above 70 for the first time since November 24. The recent rally above 70 has signaled overbought conditions and strong buying pressure, while the retracement to 62 indicates a slight slowdown.
Despite the correction, RSI remains in positive territory, indicating continued optimism among buyers.

RSI (Relative Strength Index) measures the speed and intensity of price movements, with values above 70 indicating overbought conditions and below 30 indicating oversold levels. At 62, DOT’s RSI reflects reasonable momentum, although no longer peaking.
If RSI stabilizes or surpasses 70, Polkadot could see another bull run. Conversely, if RSI falls below 60, it could indicate waning buying interest and lead to a slight price correction or retracement.
Polkadot CMF Remains Positive
Currently, DOT’s CMF (Chaikin Money Flow) is at 0.07, down from a recent peak of 0.22, the highest since November 23. This decline shows that although buying pressure is still present, but was weaker than before.
A positive CMF value still indicates net inflows into DOT, reflecting overall positive sentiment. However, the downtrend shows the possibility of a slowdown.

CMF measures the flow of money into and out of assets based on price and volume, with values above zero indicating buying pressure and values below zero indicating selling pressure. While DOT CMF remains positive at 0.07, a drop from 0.22 could signal a decline in positive momentum.
If CMF continues to decline, it could indicate increased selling activity, leading to a price correction or pullback. Conversely, a recovery towards higher levels could stimulate price momentum again.
DOT Price Prediction: Could Polkadot Hit $12 In December?
DOT’s EMAs remain bullish, with the short-term lines still above the long-term ones, signaling continued bullish momentum. However, other indicators such as RSI and CMF suggest that the current uptrend may be weakening.

If buying pressure continues to wane, Polkadot price could test support at $8.4, with the possibility of falling even deeper to $7.5 if that support fails.
Conversely, if the uptrend regains strength, DOT price could aim to reach the key resistance at $11.60. Breaking this level could push the price towards $12, a milestone not reached since April 2022.
