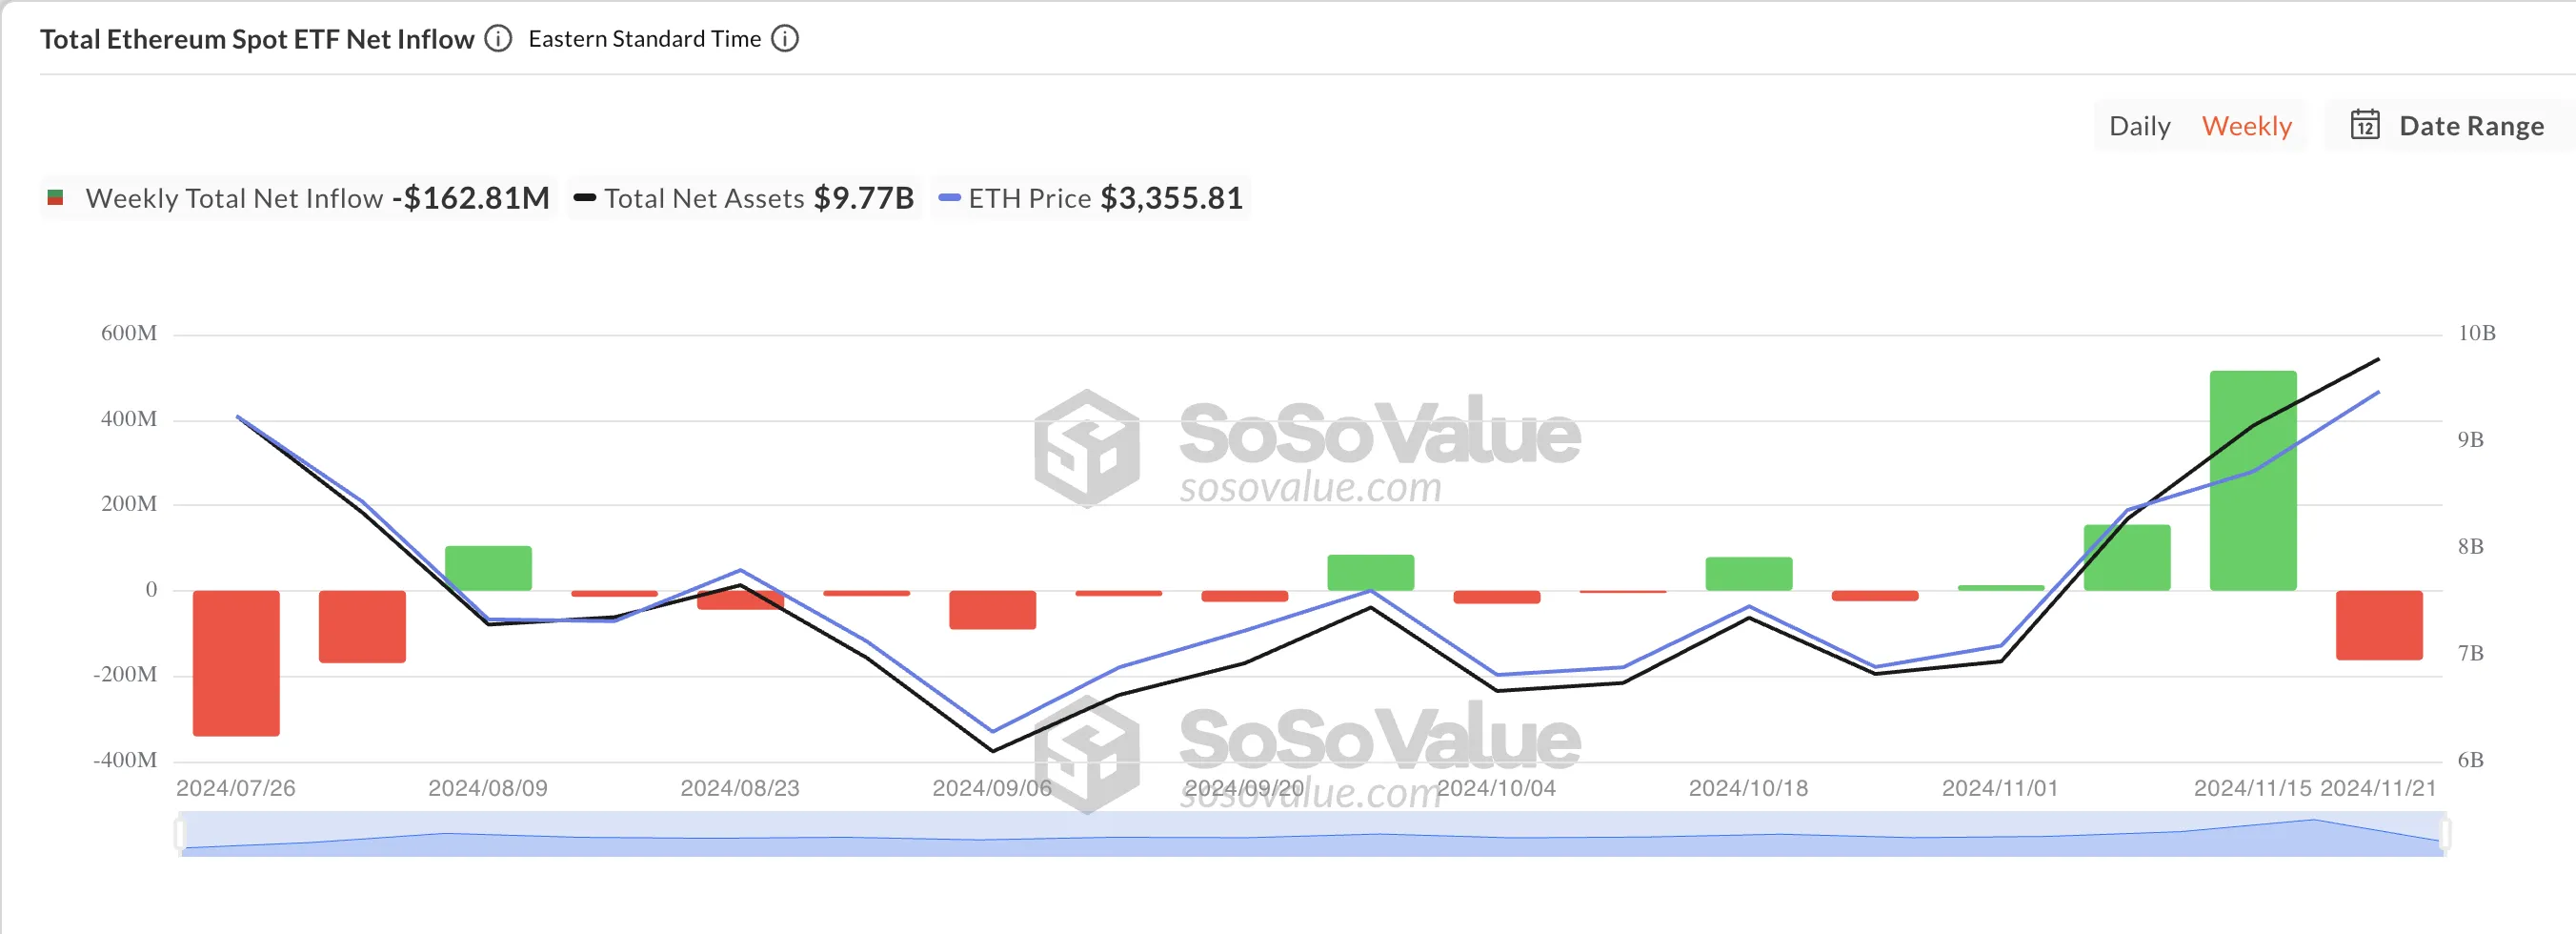
Ethereum (ETH) spot exchange-traded funds have seen significant outflows of $163 million over the past week. This comes as bullish sentiment for the leading altcoin begins to falter, leaving the coin’s price struggling to break the $3,400 resistance level.
Faced with downward price pressure, it is possible that ETH will begin to lose some of its gains in the coming weeks. This analysis will explain why.
Buying Pressure for Ethereum Hits Difficulties
According to data from SosoValue, Ethereum ETF outflows this week reached $163 million. This is the third week of highest net outflows since the funds began trading on July 23.
Notably, the Ethereum ETF’s outflow trend follows a staggering increase in inflows, reaching a record $515.17 million for the week — its highest since launch. This boom was triggered by Donald Trump’s victory in the November 5 US election, causing a parabolic price surge in the cryptocurrency market.

However, ETH price started to struggle as bearish sentiment gradually increased. TinTucBitcoin reported earlier that the ETH/BTC ratio — which measures Ethereum’s price performance against Bitcoin — has fallen to its lowest level since March 2021. This comes as profit-taking increases among investors. altcoin holders, paving the way for bears to regain control of the market.
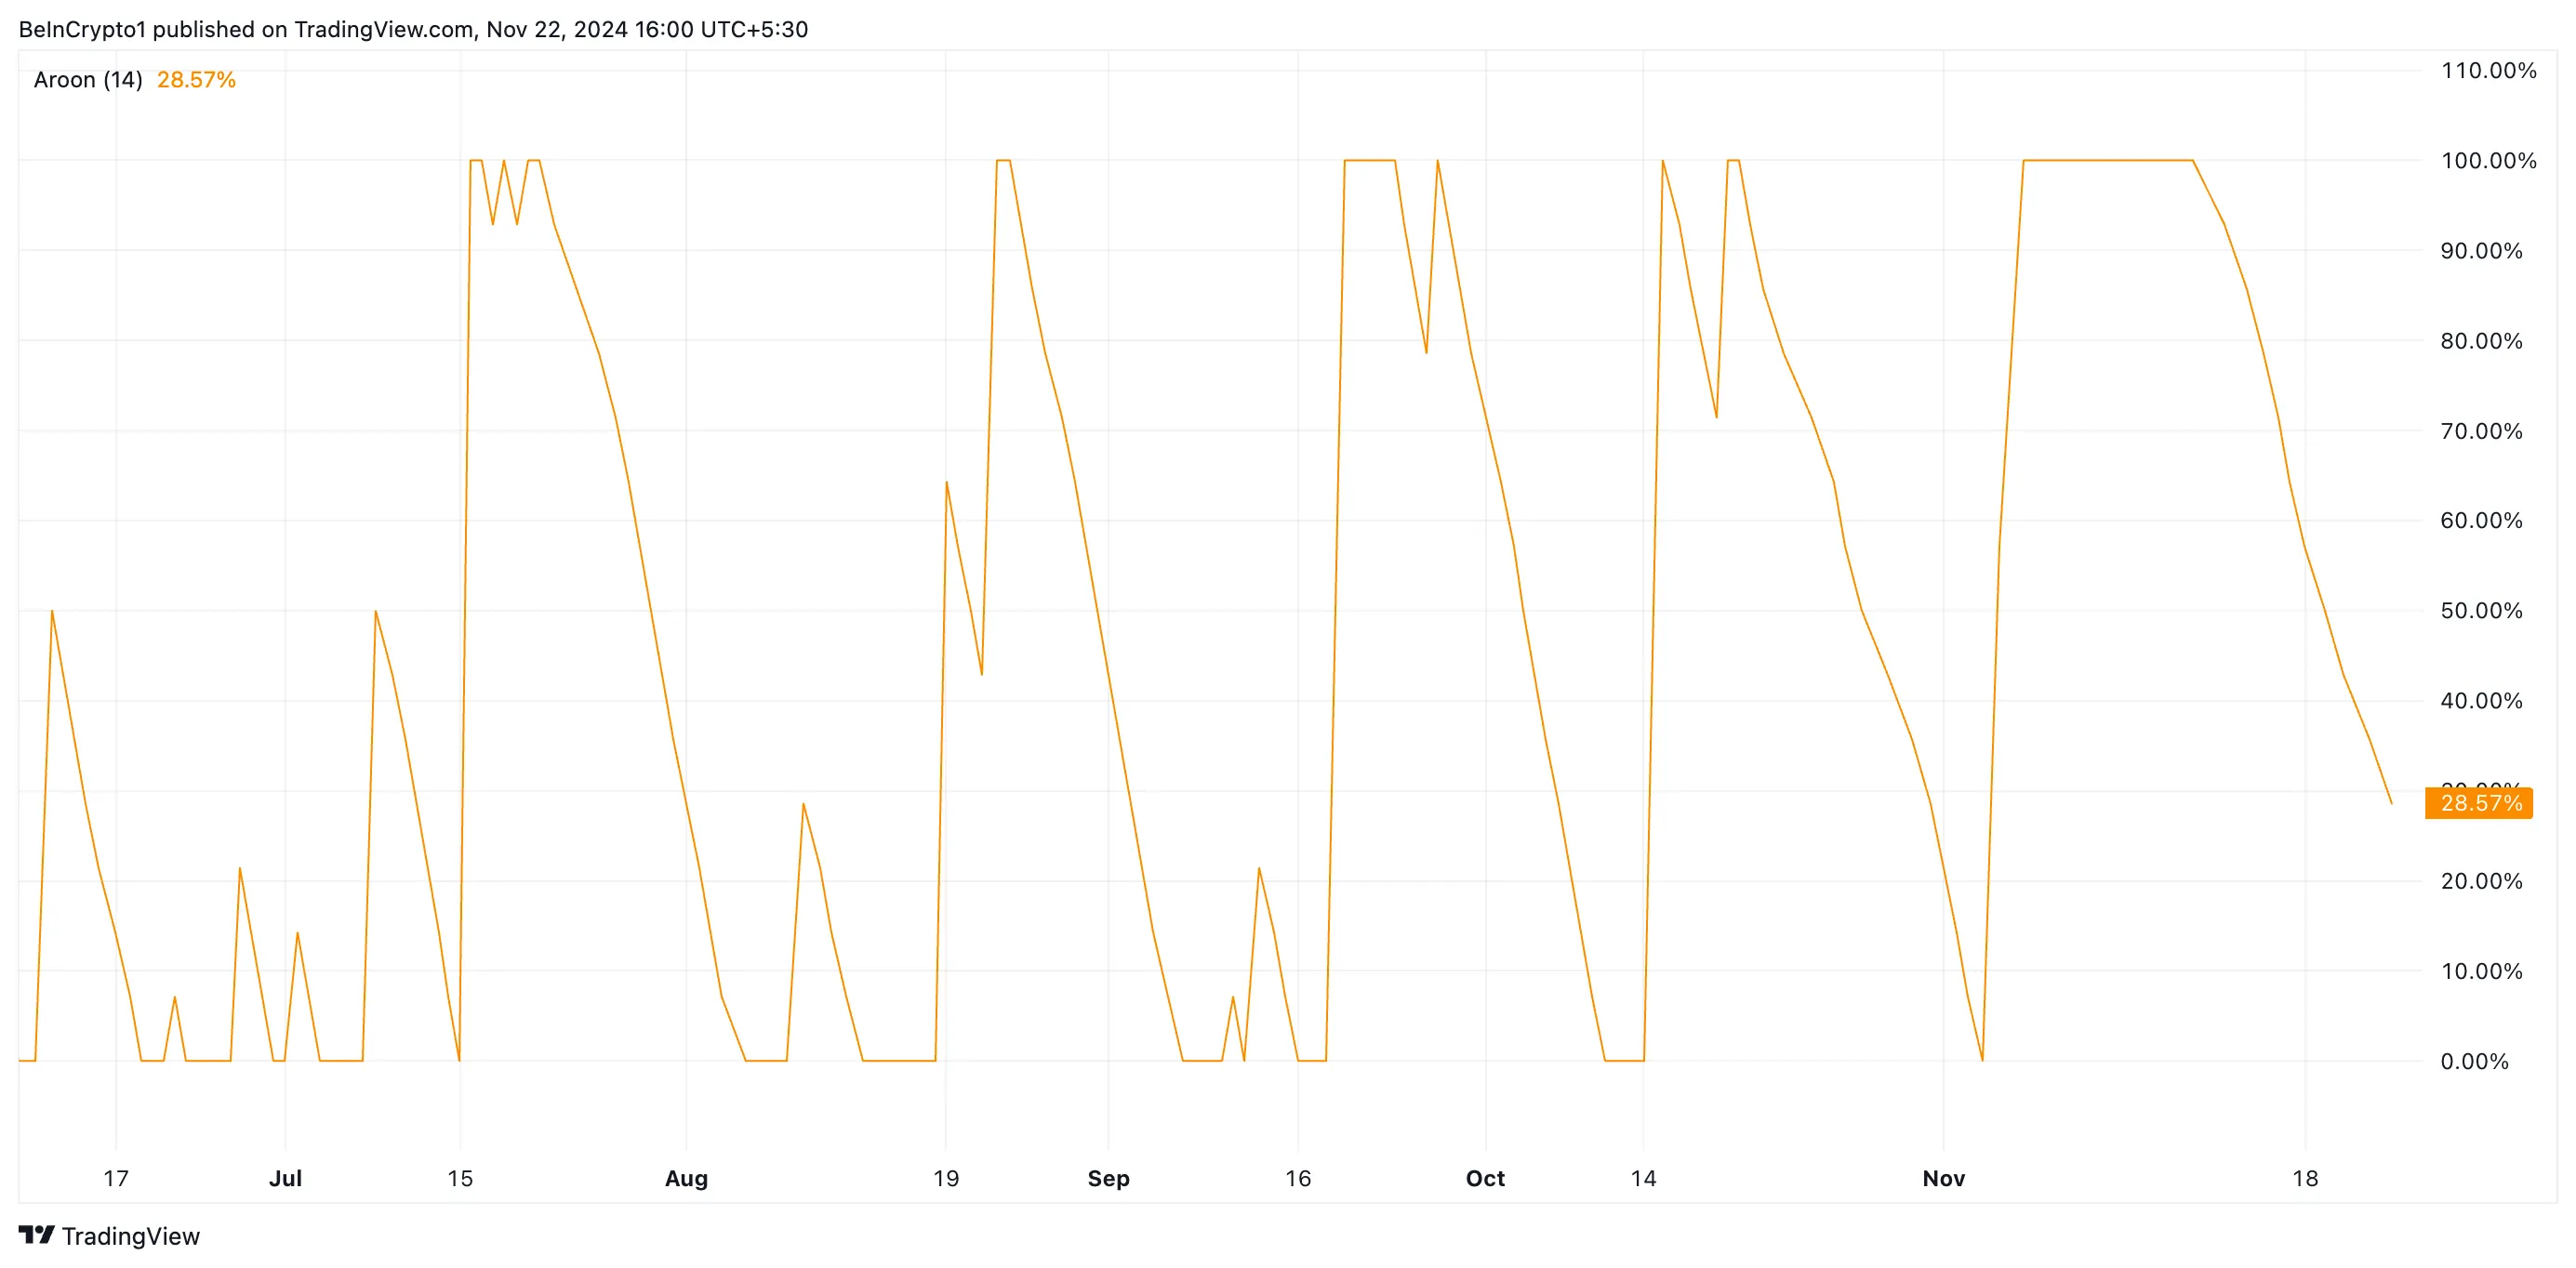
Furthermore, Ethereum’s Aroon Up Line is falling, confirming the weakening of the bullish presence in the market. At press time, the coin’s Aroon Up Line is down to 28.57%.
The Aroon indicator identifies trends and their strength. It consists of two lines: Aroon Up and Aroon Down. Aroon Up measures the time since a new high in 25 periods, while Aroon Down measures the time since a new low in 25 periods.

When the Aroon Up Line falls, it is a sign of a weakening uptrend or a possible trend reversal. This occurs when prices take longer to reach new highs, indicating a loss of momentum. A falling Aroon Up line is considered a bearish signal, showing that bullish momentum is weakening and a downtrend may occur.
ETH Price Forecast: Is a Bullish Pennant Pattern Forming?
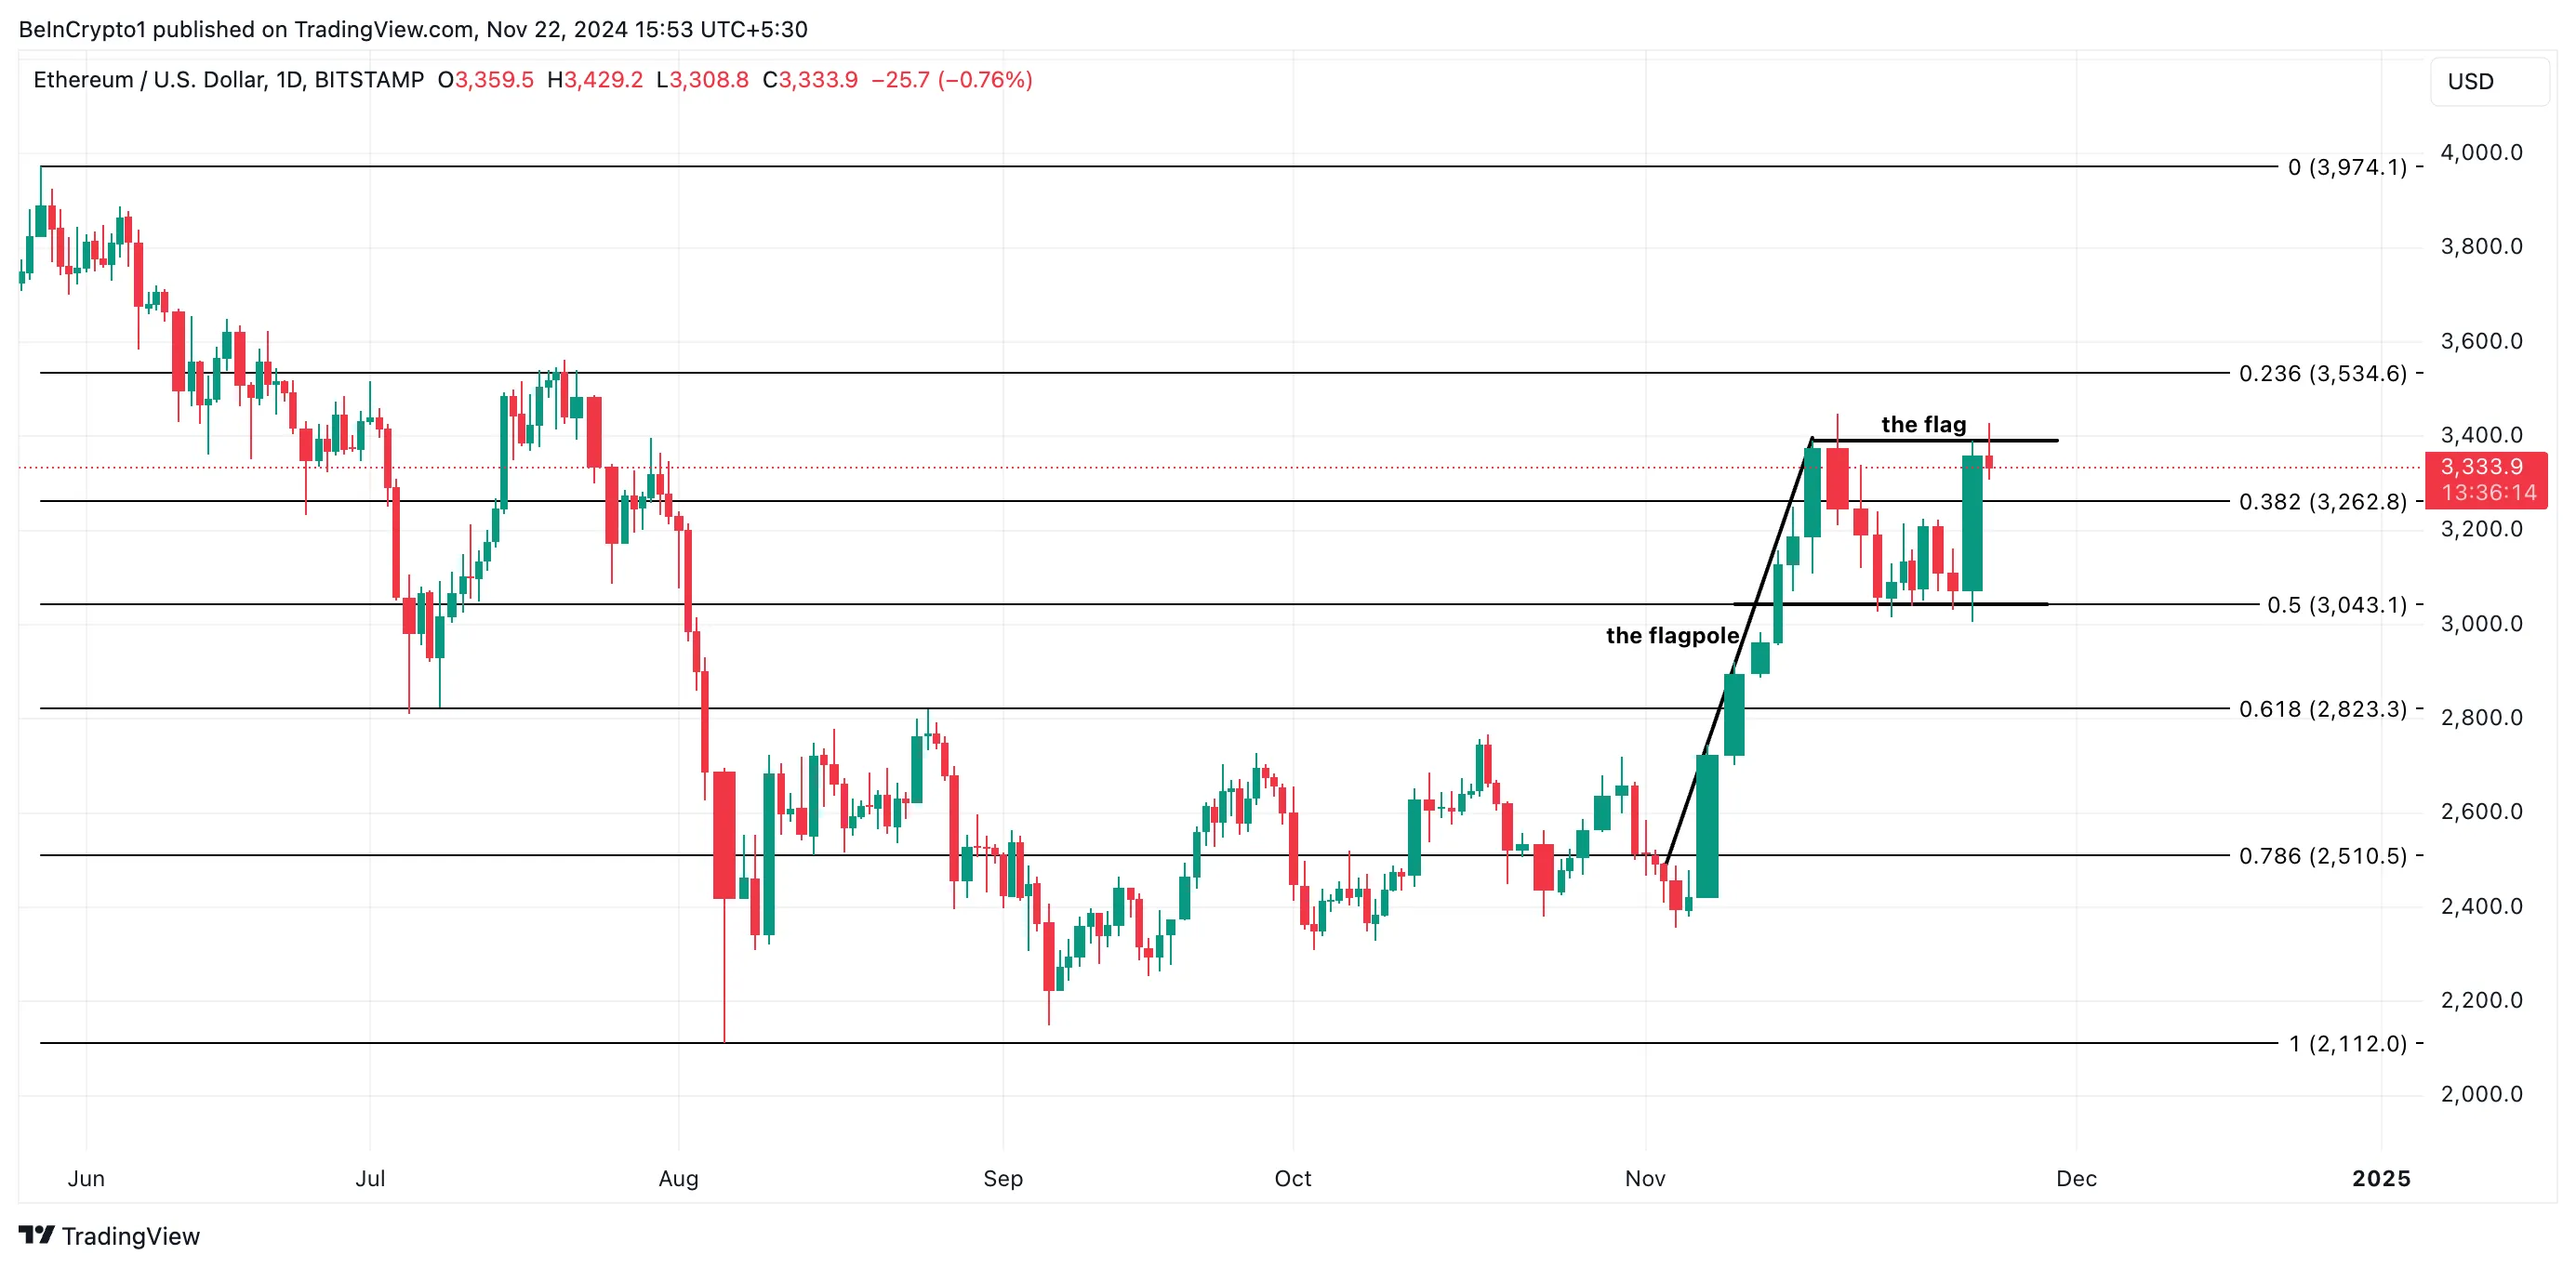
Interestingly, analysis of the ETH/USD one-day chart shows that a bullish pennant pattern is likely forming. This pattern often appears before an uptrend continues.
A bullish flag consists of a sharp price increase (flag) followed by an accumulation period (flag). When the price breaks above the flag’s resistance level, it is a potential sign for a return to the uptrend.

A successful breakout of ETH above the horizontal channel line at $3,997 would confirm the uptrend; If this happens, the price of the coin could rise to $3,534. However, if buying pressure declines further, ETH price could fall to $3,262, nullifying the bullish outlook above.
