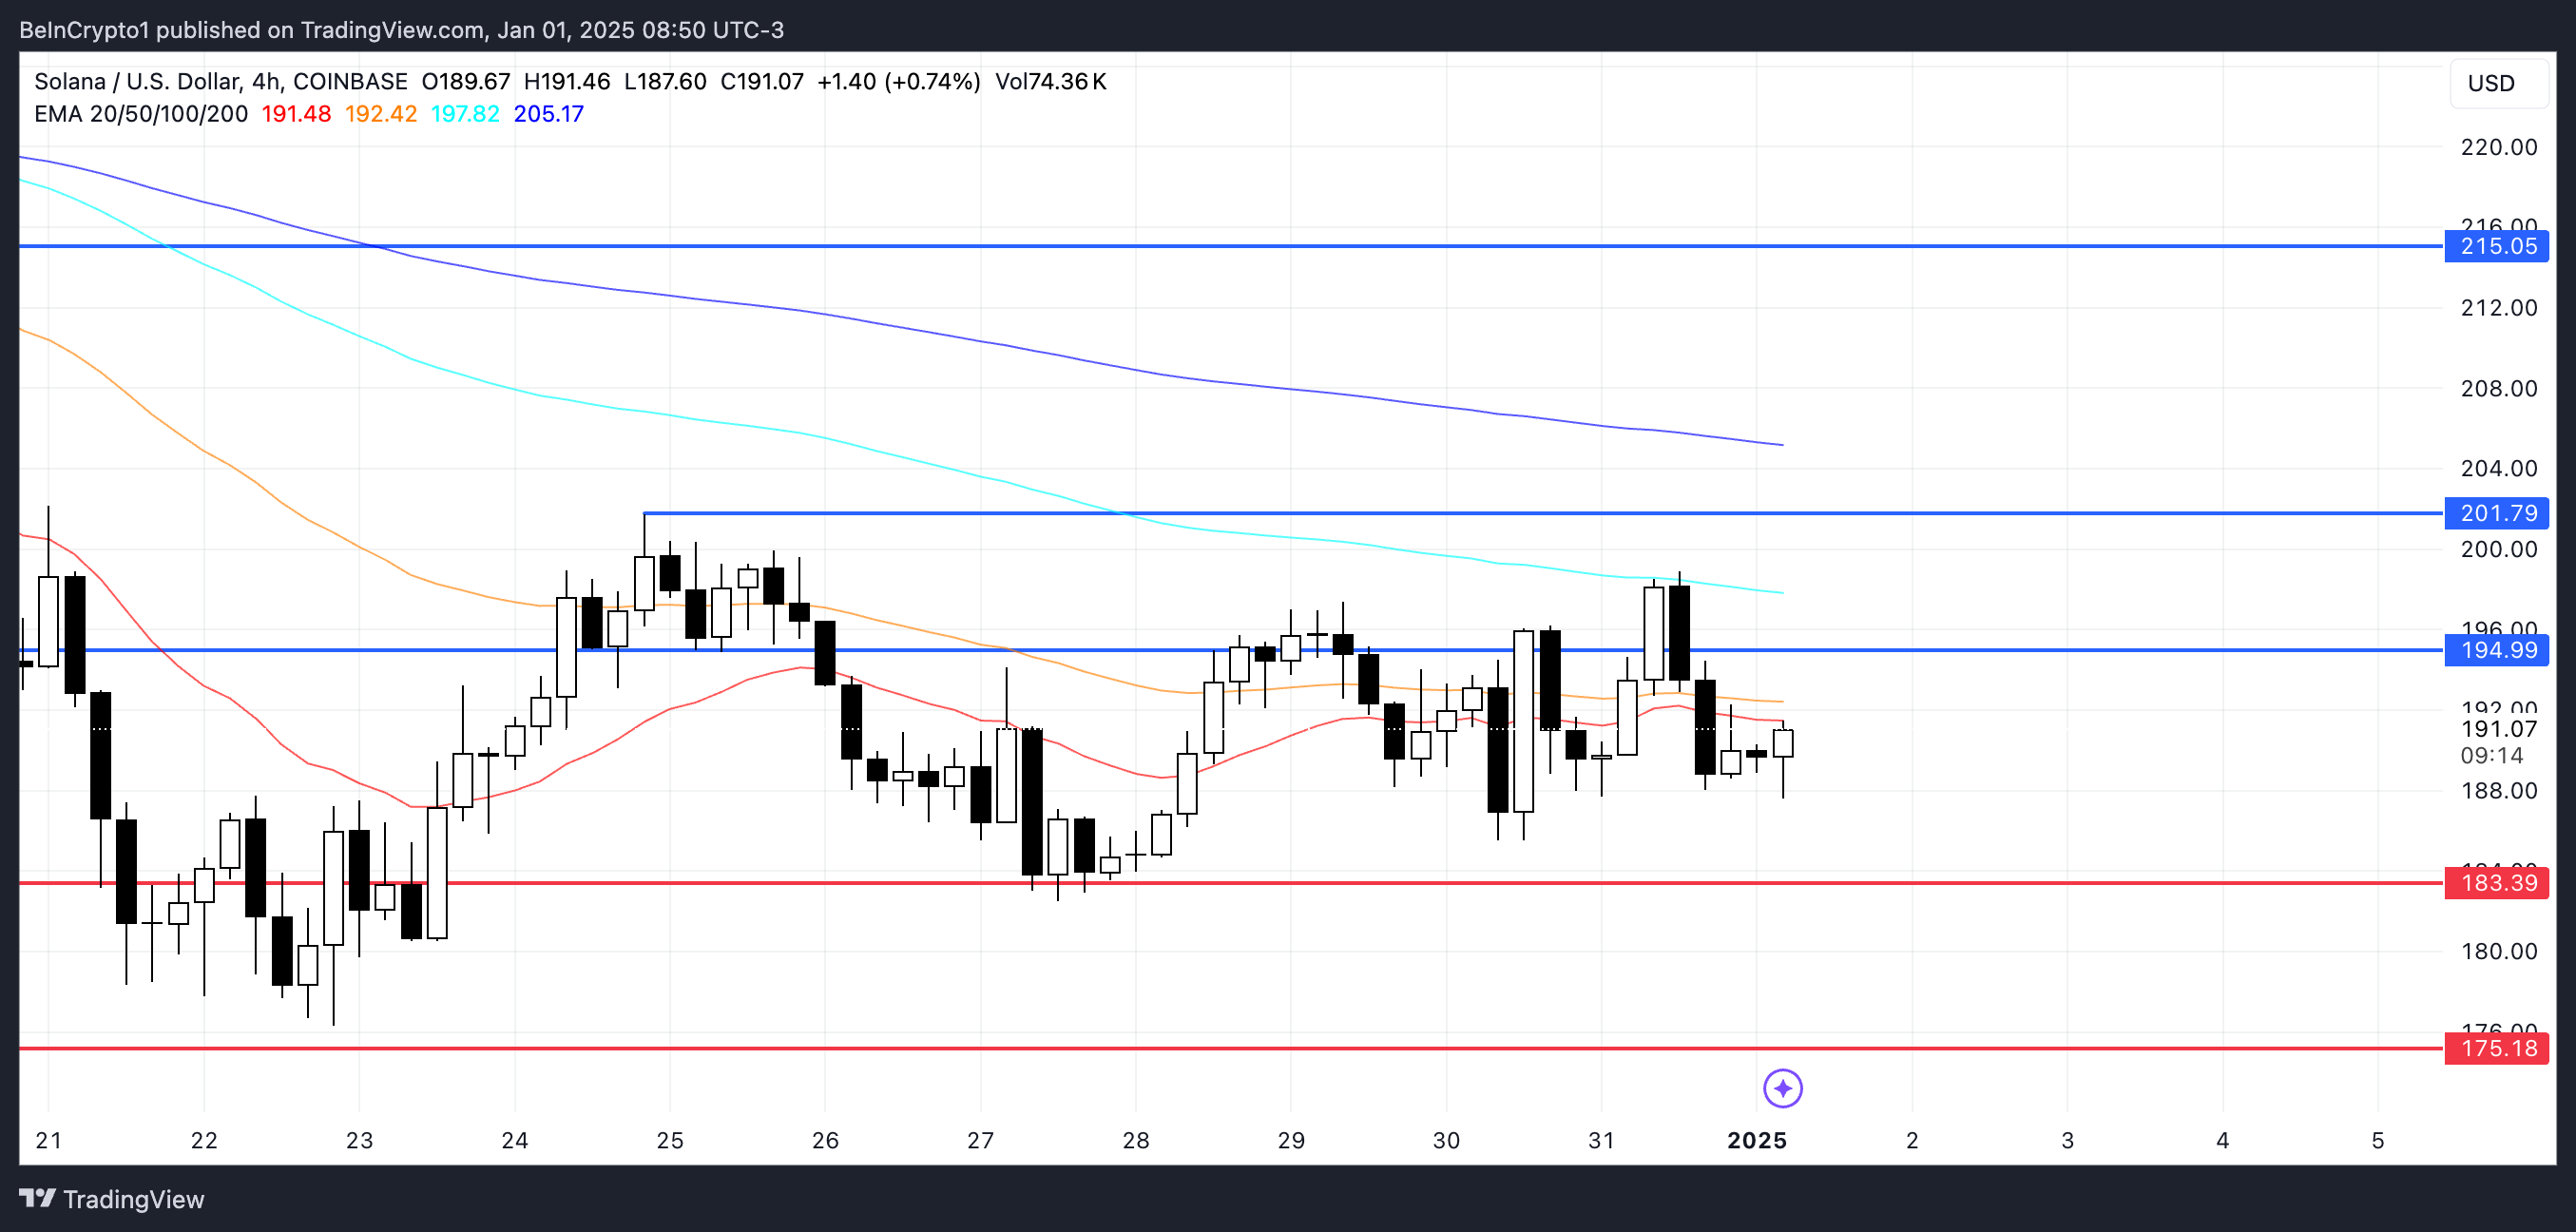
Solana (SOL) has been in a consolidation phase in recent days, posting a 2.7% decline over the past week. Indicators such as BBTrend and DMI show weak momentum, with BBTrend mild at 0.14 and ADX at a low of 12, signaling an unclear trend.
SOL’s EMAs point to a bearish pattern, although lacking a strong bearish trend, which suggests stabilization potential. Key levels at $183 support and $194 resistance will determine whether SOL continues to consolidate or make a decisive move in the near term.
SOL’s BBTrend is not yet strong
Solana’s BBTrend is currently at 0.14, reflecting a modestly positive outlook as it attempts to reach higher levels. Over the past few days, BBTrend has been steady, fluctuating between 0 and 1.08, suggesting limited momentum in both directions.
While the indicator’s positive value marks a recovery from the heavily negative levels it saw from December 21 to 26, the lack of a strong upward movement implies that SOL is struggling to build momentum. the necessary force for a stronger increase.

BBTrend, derived from Bollinger bands, measures the strength and direction of a trend. Positive values indicate upward momentum, while negative values suggest downward momentum. Although Solana’s BBTrend is no longer in negative territory, the low positive value around 0.14 reflects a market environment with limited strength.
This suggests that while selling pressure has eased, there is not enough buying activity to trigger a significant breakout, keeping SOL price in a phase of cautious accumulation. Stronger movement in BBTrend will be needed to confirm any decisive price action.
Solana Stuck in the Accumulation Phase
Solana’s DMI chart shows ADX currently at 12, remaining below 20 since December 30, indicating weak trend strength. This low ADX index implies the current downtrend lacks significant momentum, reflecting a consolidating market environment.
With both directional indexes (D+ and D-) relatively close, the chart shows a lack of clear dominance, although D- at 18.8 slightly surpassed D+ at 16, only maintaining the dominant downtrend.

Average Directional Index (ADX) measures trend strength, regardless of direction, on a scale from 0 to 100. Values above 25 indicate a strong trend, while values below 20, like the current SOL at 12, signals a weak or non-existent trend.
In the short term, this combination of low ADX and slightly dominant D- for Solana suggests that Solana is in a consolidation phase, with the downtrend losing strength but not yet reversing.
SOL Price Prediction: More Sideways Move Ahead
The EMAs for Solana’s price point to an overall bearish pattern, with the long-term lines above the short-term lines, reflecting sustained bearish momentum. However, as highlighted by the DMI and BBTrend charts, there is currently no strong trend driving SOL’s price action, consistent with its consolidation behavior.
If the downtrend strengthens, SOL price could test the support at $183, and if it fails to hold, the price could fall further to $175, indicating increased bearish pressure.

Conversely, if SOL price regains its momentum and shows an uptrend, it could challenge the resistance at $194.
A breakout above this level could lead to a test of the next resistance at $201, with the potential for a move higher to $215 if that hurdle also breaks.
