[ad_1]
As Bitcoin is trying to push BTC price above $40,000, AAVE, KSM, ALGO and TFUEL are showing very positive signs.

AAVE/USDT
Aave is trading in a large range of $280 to $581.67 for the past few months. The bulls have successfully defended the support of the range on the previous five occasions, so buyers are likely to buy back the dip once again.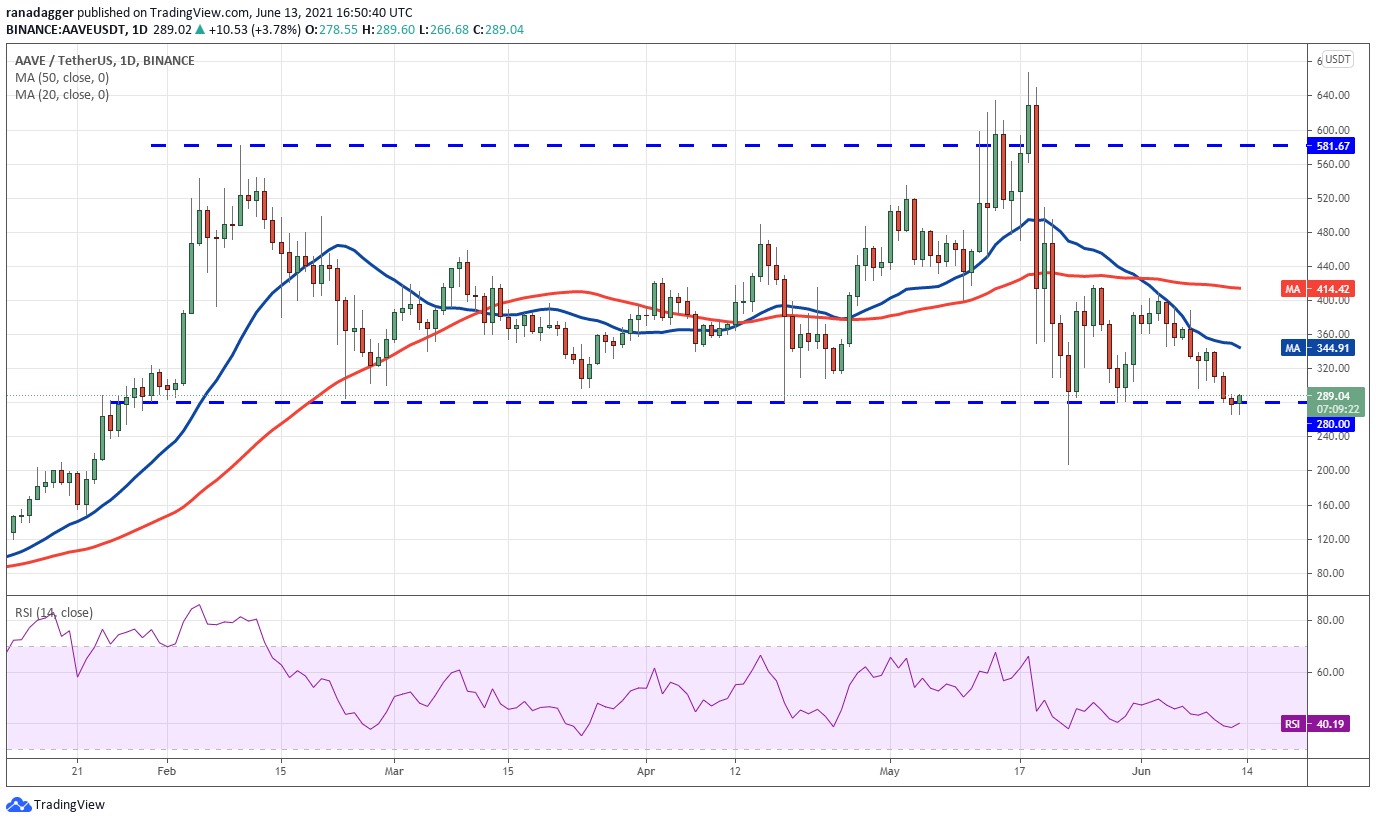
If the price recovers from the current levels, it shows that the bulls will continue to accumulate on the downside. The buyers will then attempt to push the price above the 20 EMA at $344. If they succeed, the AAVE/USDT pair can rally to the 50 SMA, which could act as a stiff hurdle.
If the price turns down from the 50-day SMA, the pair could consolidate in the $280 to $414 range for a few days. Conversely, a break above the 50-day SMA will clear the way for a march north towards the $581.67 mark.
This positive view will be invalidated if the price turns down from the 20-day EMA and breaks below the $280 support. That will encourage the bears to then attempt to drag the price down to 208.09 and then to $160.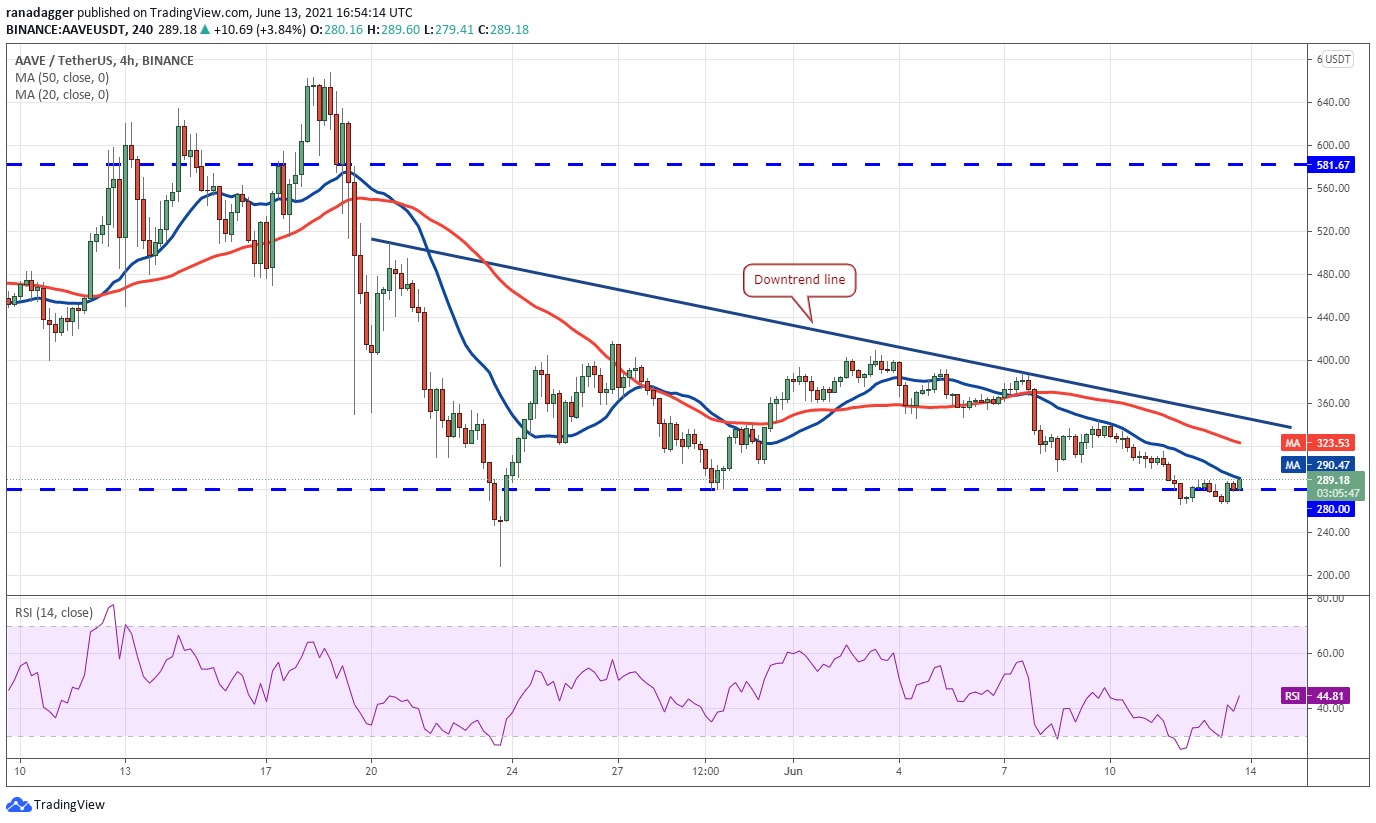
The H4 chart shows that the bears dragged the price below $280 but they are struggling to sustain the lower levels. However, the moving averages are sloping down and the RSI is in the negative zone, showing an advantage for the bears.
If the price turns down from the current levels and breaks below $266.68, the pair might start its downward journey. This negative view will be invalidated if the bulls push the price above the downtrend line. Such a move would indicate that the correction is over and the pair can then rally to $500.
KSM/USDT
Kusama (KSM) is witnessing volatile moves in the past few days. Although the bulls pushed the price above the overhead resistance of $480 on June 9, it failed to sustain the higher levels and the price dropped below the level on June 10. This shows that the bears are selling to recover.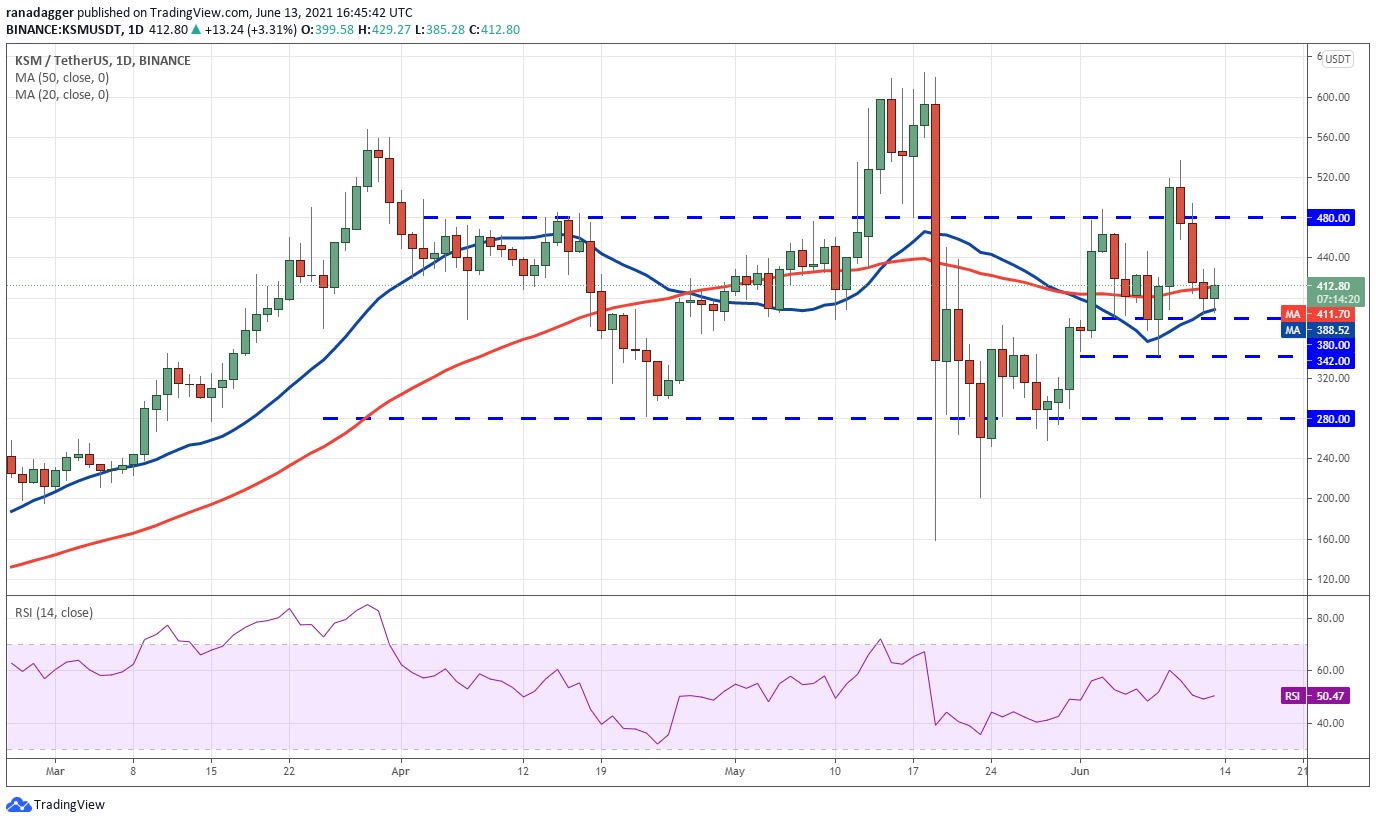
However, the buyers did not allow the price to break below the 20 EMA at $388. This shows that sentiment is turning positive as the bulls buy on the dips to the 20-day EMA.
The bullish 20-day EMA and the RSI near the midpoint show a slight advantage to the bulls. Buyers will now make one more attempt to push the price above $480. If they succeed, the KSM/USD pair can rally to $537 and then retest the all-time high at $625.
This positive view will be invalidated if the price turns down from the current level or the overhead resistance and breaks below $360. That could drag the price down to $280.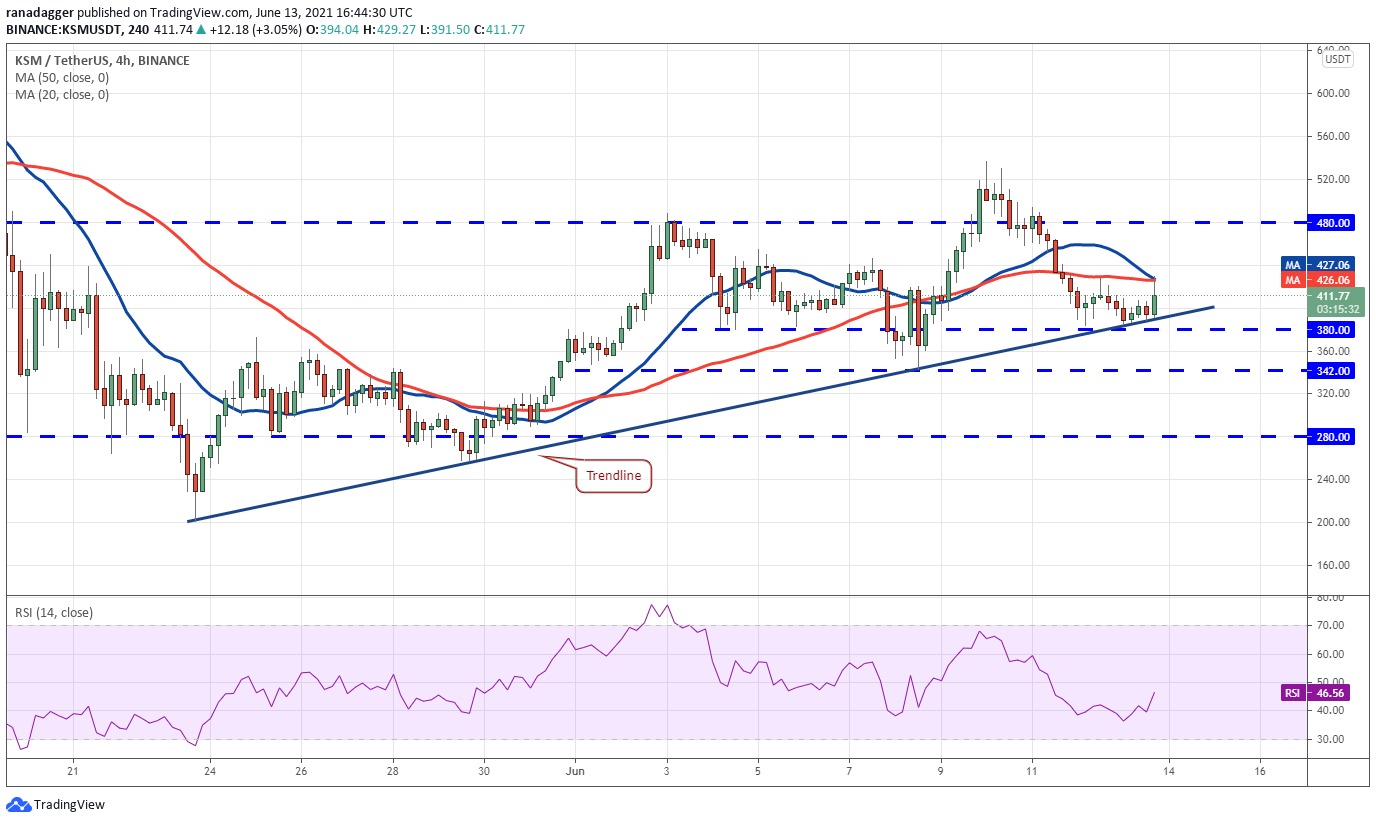
The H4 chart shows that the bulls are trying to defend the trendline support. However, the 20 EMA has turned down and the RSI is in the negative zone, showing that the bears have the upper hand.
If sellers drop the price below $380, the pair can drop to $342. A break below this support can lead to a drop to $280.
This negative view will be invalidated if the bulls can push the price above $429. That could attract buying, pushing the pair to $480.
ALGO/USDT
Algorand (ALGO) broke out of the trendline on June 12 and rose above the 20 EMA, which shows that the bulls are buying on the downside. The flat 20-day EMA and the RSI near the midpoint suggest that selling pressure has subsided.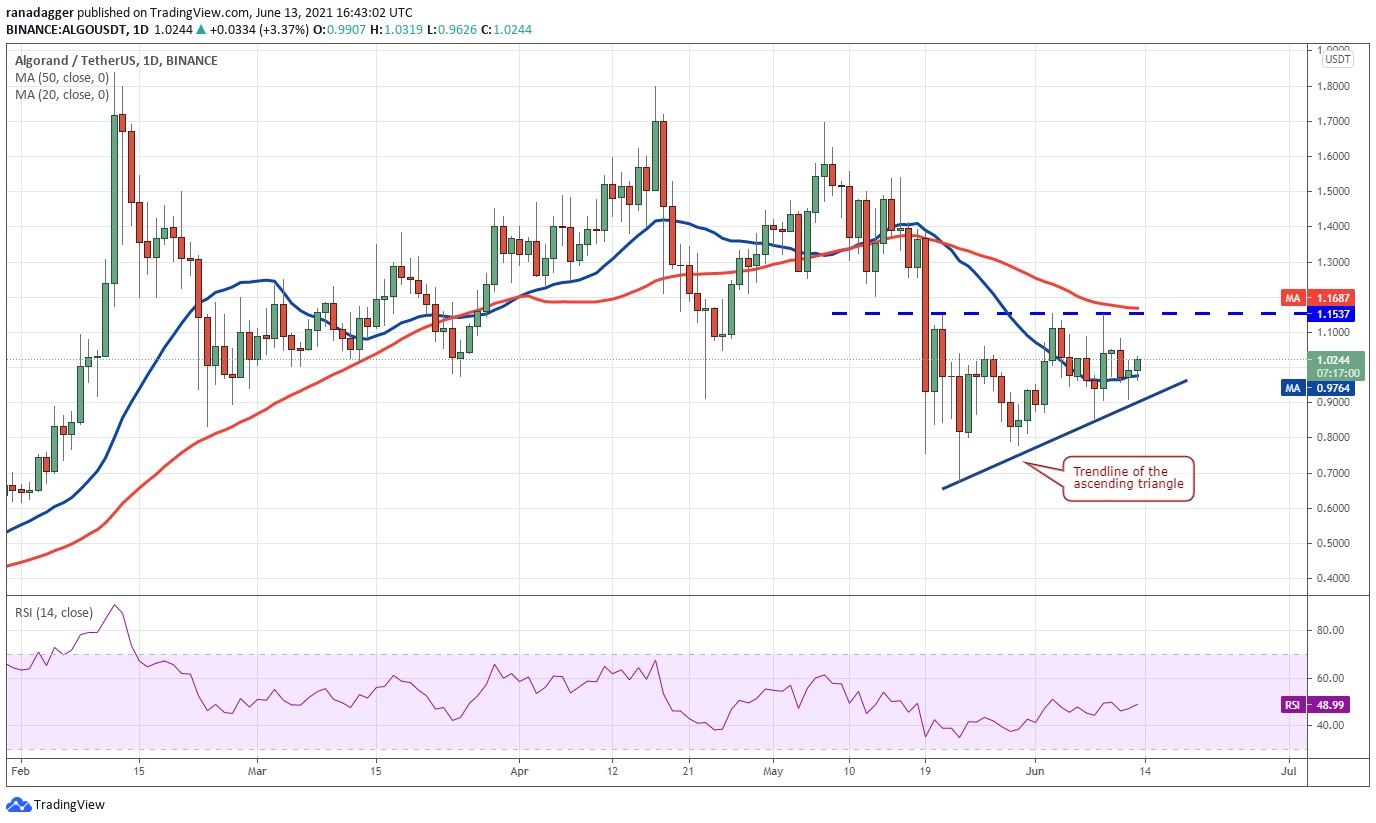
The price action over the past few days has formed an ascending triangle pattern, which will complete on a breakout and close above $1.15. If the bulls manage to sustain the price above $1.15, the ALGO/USDT pair can recover to the target objective at $1.63.
Contrary to this assumption, if the price turns down from $1.15, the pair can extend its stay inside the triangle for a few more days. A breakdown and close below the trendline will invalidate the bullish view and open the gates for a drop to $0.80 and then $0.67.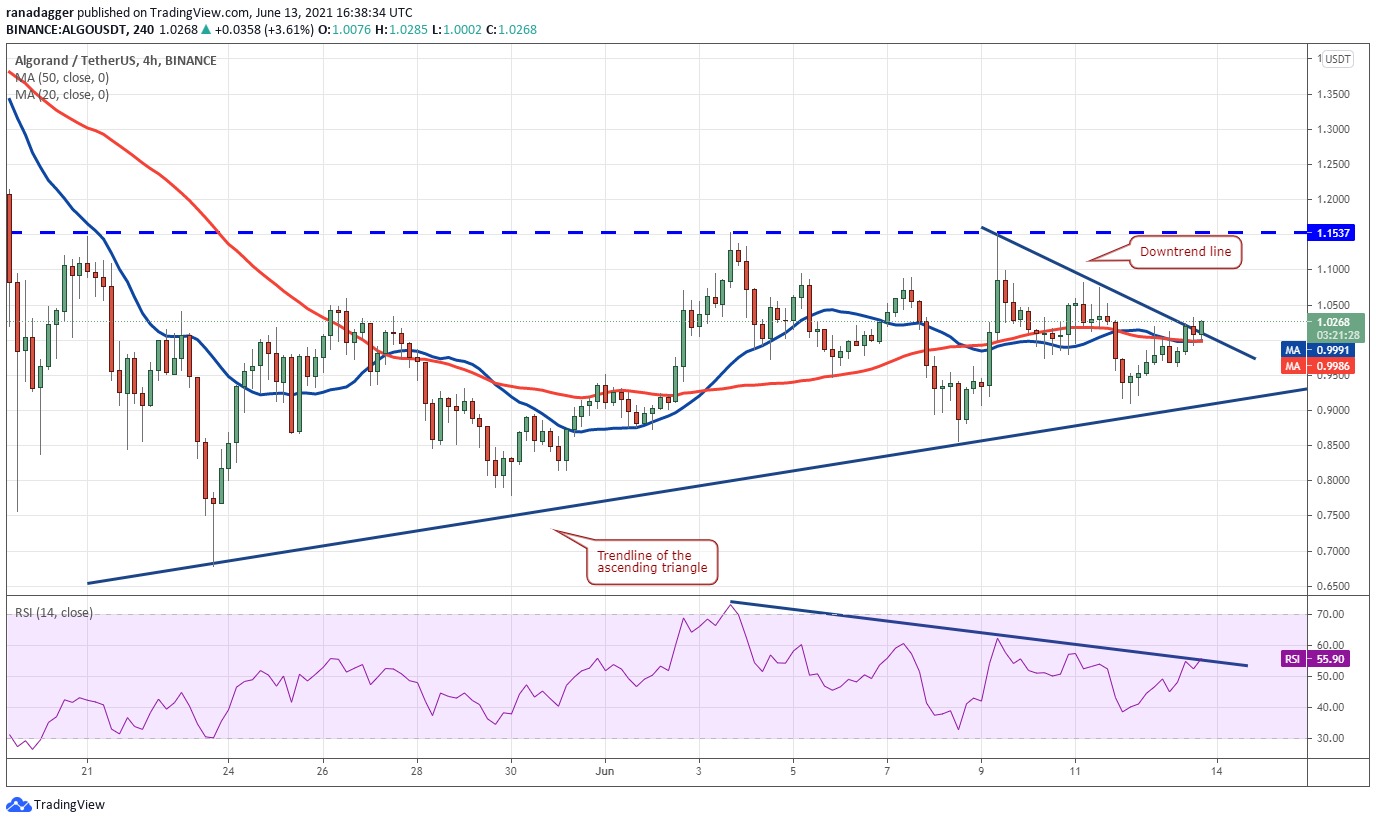
The H4 chart shows that the bulls are trying to push the price above the downtrend line. If the breakout can be sustained, a rally to $1.15 is possible. A breakout and close above this resistance could start a new uptrend.
Conversely, if the price turns down from the current levels and breaks below the moving averages, the bears will make one more move to push the price below the trendline. If they succeed, this will signal the start of a deeper correction.
TFUEL/USDT
Theta Fuel (TFUEL) rallied to a new all-time high at $0.679 on June 9 but the bulls were unable to sustain the higher levels as seen from the long wick on the intraday candlestick. This was followed by a sharp drop to the 20 EMA at $0.41 on June 12.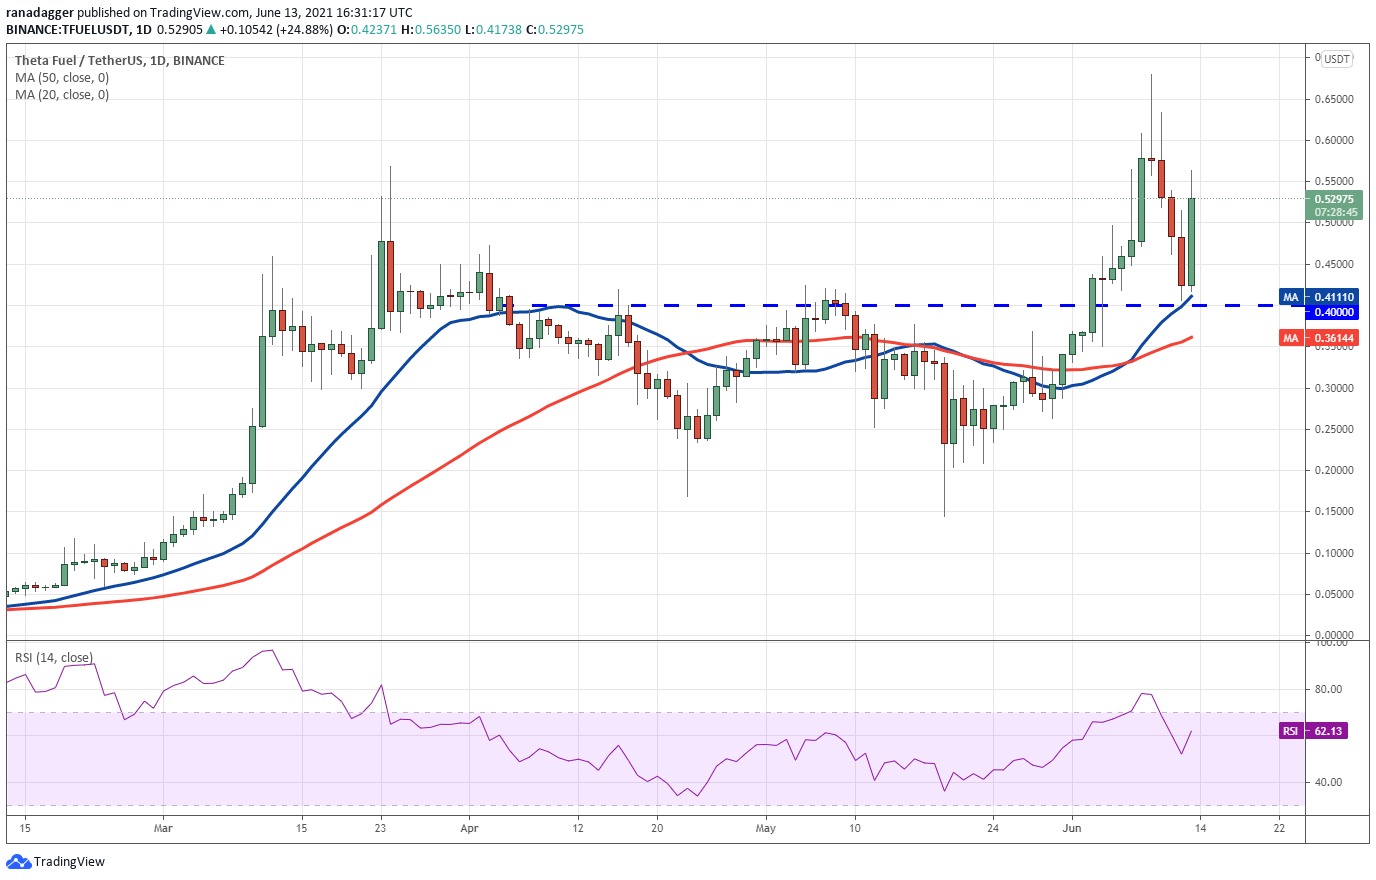
The strong bounce off the 20-day EMA shows that sentiment is positive and traders are actively buying on the downside. The bulls will now attempt to push the price to the all-time high, where they are likely to encounter stiff resistance from the bears.
If the price turns down from the all-time high, the bears will make one more move to drag the price below the 20-day EMA. If they succeed, it will suggest the start of a deeper correction.
Alternatively, if the buyers push the price above the all-time high, the TFUEL/USDT pair can resume the uptrend, with the next target target at 0.85 and then $1.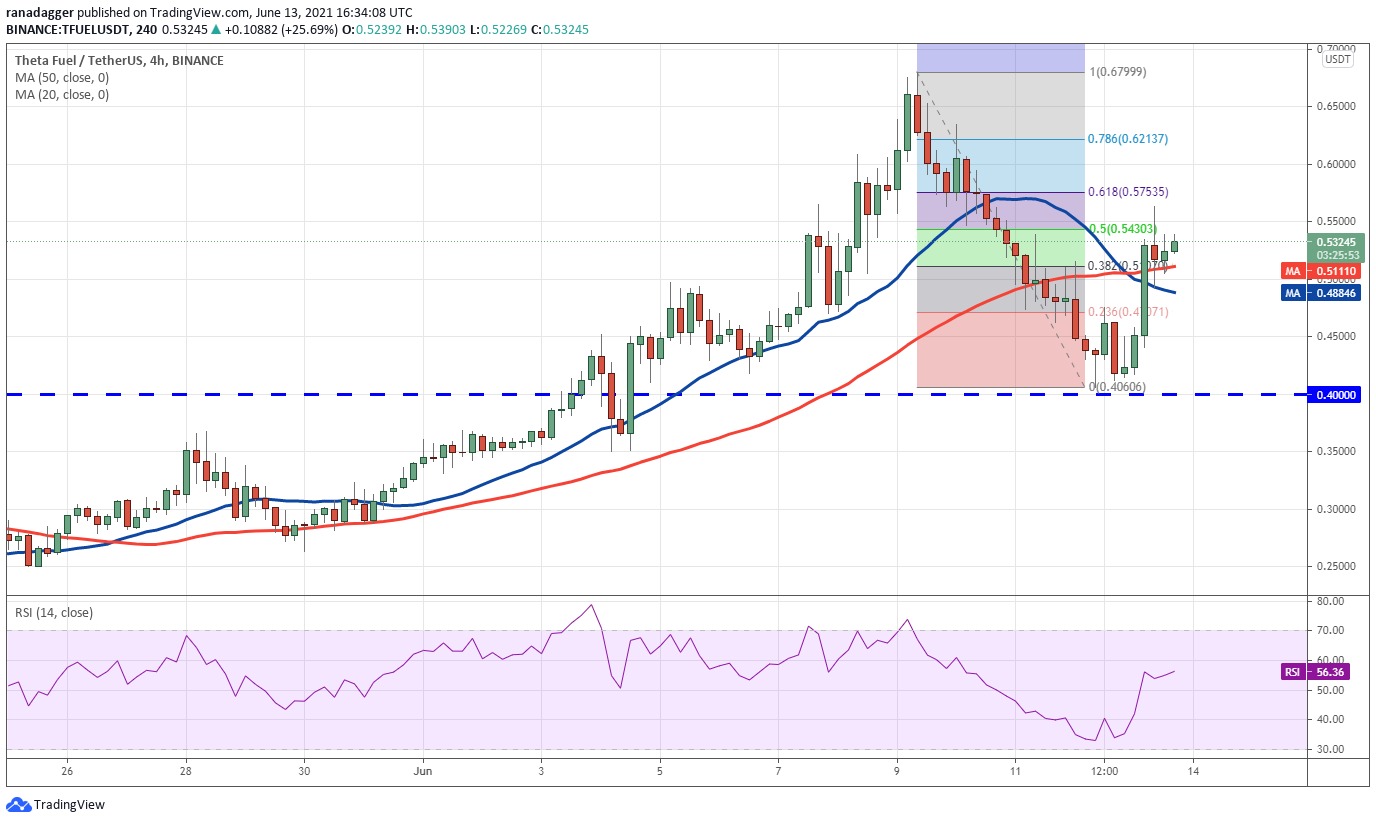
The H4 chart shows that the pair has recovered strongly from the $0.40 support, which shows consolidation at lower levels. However, the relief rally is facing resistance just below the 61.8% Fibonacci retracement level at $0.57.
This shows that the bears have not given up and are selling when there is a rally. If the price falls below the 20 EMA, the sellers will attempt to drag the price down to $0.40. If that happens, the pair could consolidate between these two levels for a few days.
Also, if the price recovers from the 20 EMA, it will show positive sentiment and the bulls are not waiting for a deeper drop to buy. That would increase the likelihood of a break above $0.57. The pair could then rally to retest the all-time high.
Synthetic
Maybe you are interested:
[ad_2]


